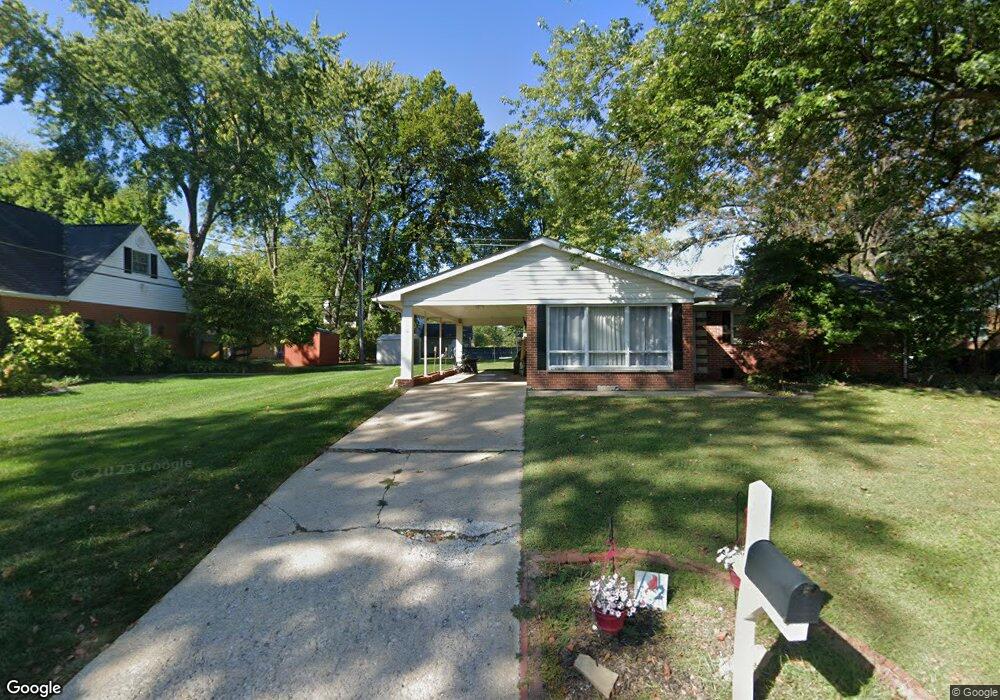
3859 Tanbark Dr Swansea, IL 62226
Estimated Value: $184,000 - $225,000
3
Beds
2
Baths
1,257
Sq Ft
$163/Sq Ft
Est. Value
About This Home
This home is located at 3859 Tanbark Dr, Swansea, IL 62226 and is currently estimated at $205,150, approximately $163 per square foot. 3859 Tanbark Dr is a home located in St. Clair County with nearby schools including Wolf Branch Elementary School, Wolf Branch Middle School, and Elite Scholars STEAM Academy.
Ownership History
Date
Name
Owned For
Owner Type
Purchase Details
Closed on
Apr 4, 2020
Sold by
Paton Aaron and Paton Melissa
Bought by
Paton Enterprises Llc
Current Estimated Value
Purchase Details
Closed on
Mar 20, 2013
Sold by
Paton Melissa and Buening Melissa
Bought by
Paton Aaron P and Paton Melissa
Home Financials for this Owner
Home Financials are based on the most recent Mortgage that was taken out on this home.
Original Mortgage
$73,500
Outstanding Balance
$15,497
Interest Rate
4%
Mortgage Type
New Conventional
Estimated Equity
$189,653
Purchase Details
Closed on
Nov 29, 2001
Sold by
Obrien Thomas I and Obrien Sheila M
Bought by
Buening Melissa
Home Financials for this Owner
Home Financials are based on the most recent Mortgage that was taken out on this home.
Original Mortgage
$54,900
Interest Rate
6.64%
Mortgage Type
Purchase Money Mortgage
Create a Home Valuation Report for This Property
The Home Valuation Report is an in-depth analysis detailing your home's value as well as a comparison with similar homes in the area
Home Values in the Area
Average Home Value in this Area
Purchase History
| Date | Buyer | Sale Price | Title Company |
|---|---|---|---|
| Paton Enterprises Llc | -- | Attorney | |
| Paton Aaron P | -- | Community Title Shiloh Llc | |
| Buening Melissa | $61,000 | Chicago Title |
Source: Public Records
Mortgage History
| Date | Status | Borrower | Loan Amount |
|---|---|---|---|
| Open | Paton Aaron P | $73,500 | |
| Closed | Buening Melissa | $54,900 |
Source: Public Records
Tax History Compared to Growth
Tax History
| Year | Tax Paid | Tax Assessment Tax Assessment Total Assessment is a certain percentage of the fair market value that is determined by local assessors to be the total taxable value of land and additions on the property. | Land | Improvement |
|---|---|---|---|---|
| 2024 | $4,063 | $50,552 | $9,836 | $40,716 |
| 2023 | $3,635 | $44,793 | $9,700 | $35,093 |
| 2022 | $3,407 | $40,797 | $8,836 | $31,961 |
| 2021 | $3,332 | $39,122 | $8,473 | $30,649 |
| 2020 | $3,244 | $36,433 | $7,890 | $28,543 |
| 2019 | $3,151 | $36,309 | $8,052 | $28,257 |
| 2018 | $3,073 | $35,382 | $7,846 | $27,536 |
| 2017 | $2,995 | $34,440 | $7,637 | $26,803 |
| 2016 | $2,974 | $33,253 | $7,374 | $25,879 |
| 2014 | $2,510 | $31,641 | $6,632 | $25,009 |
| 2013 | $2,508 | $31,641 | $6,632 | $25,009 |
Source: Public Records
Map
Nearby Homes
- 505 Thistle Ln
- 3920 Michael John Dr
- 525 Big Bend Blvd
- 201 Big Bend Blvd
- 109 Bourdelais Dr
- 3944 Appaloosa Dr
- 4171 Addiston Dr
- 3857 Appaloosa Dr
- 4167 Addiston Dr
- 4906 Lawrence Dr
- 4480 Biverton Dr
- 2 Mercury Dr
- 34 Twilight Dr
- 224 Hall Point
- 1709 Old Park Ln
- 1705 Old Park Ln
- 113 Lakeland Hills Dr
- 1737 Old Park Ln
- 1878 Old Park Ln
- 3928 Red Bird Ln
- 3863 Tanbark Dr
- 3855 Tanbark Dr
- 404 Crestwood Dr
- 409 Crestwood Dr
- 3856 Tanbark Dr
- 3867 Tanbark Dr
- 3851 Tanbark Dr
- 3852 Tanbark Dr
- 3860 Tanbark Dr
- 404 Green Haven Dr
- 408 Crestwood Dr
- 408 Green Haven Dr
- 3848 Tanbark Dr
- 3864 Tanbark Dr
- 413 Crestwood Dr
- 3859 Timberlake Dr
- 3855 Timberlake Dr
- 3847 Tanbark Dr
- 3863 Timberlake Dr
- 412 Green Haven Dr