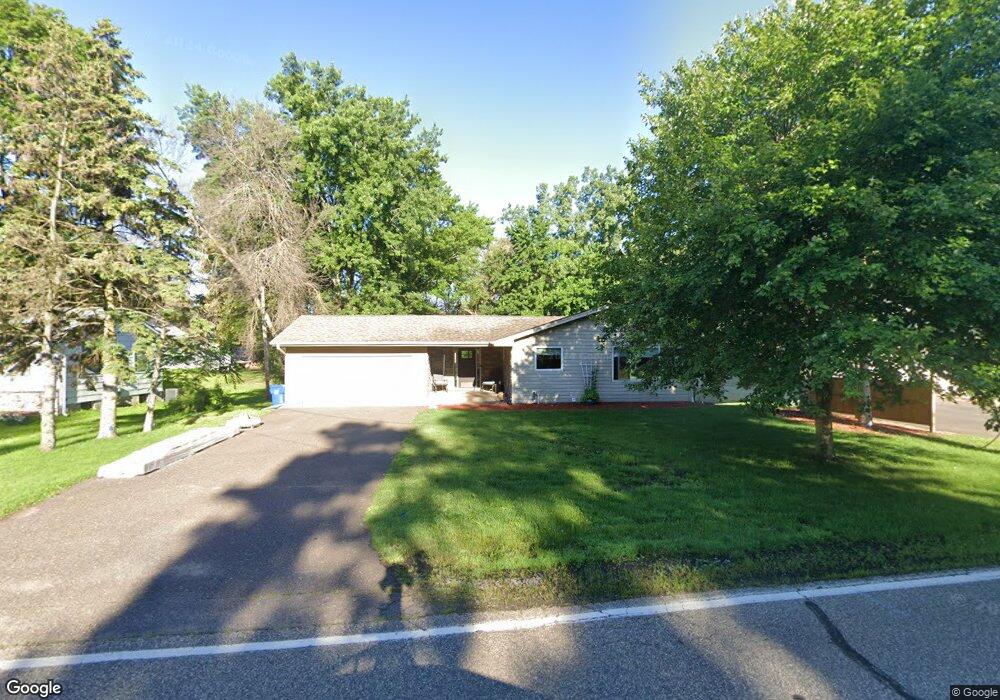
3865 Clover Ave Saint Paul, MN 55127
Estimated Value: $400,000 - $432,000
3
Beds
2
Baths
1,876
Sq Ft
$222/Sq Ft
Est. Value
About This Home
This home is located at 3865 Clover Ave, Saint Paul, MN 55127 and is currently estimated at $416,817, approximately $222 per square foot. 3865 Clover Ave is a home located in Ramsey County with nearby schools including Vadnais Heights Elementary School, Sunrise Park Middle School, and AFSA High School.
Ownership History
Date
Name
Owned For
Owner Type
Purchase Details
Closed on
Nov 30, 2021
Sold by
Attaway Elizabeth A and Attaway Christopher D
Bought by
Yamamoto Janice M
Current Estimated Value
Home Financials for this Owner
Home Financials are based on the most recent Mortgage that was taken out on this home.
Original Mortgage
$296,000
Outstanding Balance
$272,169
Interest Rate
3.09%
Mortgage Type
New Conventional
Estimated Equity
$144,648
Purchase Details
Closed on
Apr 13, 2017
Sold by
Glass Peter K and Galss Shio Maple Liudan
Bought by
Attaway Elizabeth A and Attaway Charstopher D
Home Financials for this Owner
Home Financials are based on the most recent Mortgage that was taken out on this home.
Original Mortgage
$225,223
Interest Rate
4.1%
Mortgage Type
FHA
Purchase Details
Closed on
Jan 21, 1998
Sold by
Perron Jerome L and Perron Joyce M
Bought by
Alexander Joshua T D and Alexander Judith M
Create a Home Valuation Report for This Property
The Home Valuation Report is an in-depth analysis detailing your home's value as well as a comparison with similar homes in the area
Home Values in the Area
Average Home Value in this Area
Purchase History
| Date | Buyer | Sale Price | Title Company |
|---|---|---|---|
| Yamamoto Janice M | $370,000 | Legacy Title | |
| Attaway Elizabeth A | $240,060 | Ancona Title & Escrow | |
| Alexander Joshua T D | $89,750 | -- |
Source: Public Records
Mortgage History
| Date | Status | Borrower | Loan Amount |
|---|---|---|---|
| Open | Yamamoto Janice M | $296,000 | |
| Previous Owner | Attaway Elizabeth A | $225,223 |
Source: Public Records
Tax History Compared to Growth
Tax History
| Year | Tax Paid | Tax Assessment Tax Assessment Total Assessment is a certain percentage of the fair market value that is determined by local assessors to be the total taxable value of land and additions on the property. | Land | Improvement |
|---|---|---|---|---|
| 2025 | $4,670 | $397,200 | $75,500 | $321,700 |
| 2023 | $4,670 | $358,700 | $75,500 | $283,200 |
| 2022 | $3,384 | $368,700 | $75,500 | $293,200 |
| 2021 | $4,714 | $256,000 | $75,500 | $180,500 |
| 2020 | $3,056 | $257,000 | $74,900 | $182,100 |
| 2019 | $2,714 | $225,400 | $74,900 | $150,500 |
| 2018 | $2,474 | $215,700 | $74,900 | $140,800 |
| 2017 | $2,340 | $201,200 | $74,900 | $126,300 |
| 2016 | $2,320 | $0 | $0 | $0 |
| 2015 | $2,218 | $178,500 | $74,900 | $103,600 |
| 2014 | $2,210 | $0 | $0 | $0 |
Source: Public Records
Map
Nearby Homes
- 3770 Edgerton St
- 3857 Stockdale Dr
- 449 Bear Ct
- 3611 Edgerton St
- 3736 Centerville Rd
- 383 Tessier Cir
- 421 Oak Creek Ct
- 565 Oak Creek Dr S
- 4085 Isaac Ct
- 4087 Isaac Ct
- 3693 Oak Creek Dr W
- 3608 Oak Creek Terrace
- 4174 Oakcrest Dr
- 4136 Thornhill Ln
- 1020 Horizon St
- 4252 Heritage Dr
- 731 Berwood Ave
- 4232 Bridgewood Terrace
- 4185 Centerville Rd
- 4363 Bramblewood Ave
- 3867 Clover Ave
- 3863 3863 Clover Ave
- 3863 Clover Ave
- 625 Stockdale Rd
- 611 Stockdale Rd
- 611 611 Stockdale-Road-
- 611 611 Stockdale Rd
- 3866 3866 Clover Ave
- 3866 Clover Ave
- 3875 Clover Ave
- 3875 Clover Ave
- 3875 Clover Ave
- 3868 Clover Ave
- 603 Stockdale Rd
- 603 603 Stockdale Rd
- 3870 Clover Ave
- 387X Clover Ave
- 655 Stockdale Rd
- 3884 Clover Ave
- 3884 Clover Ave