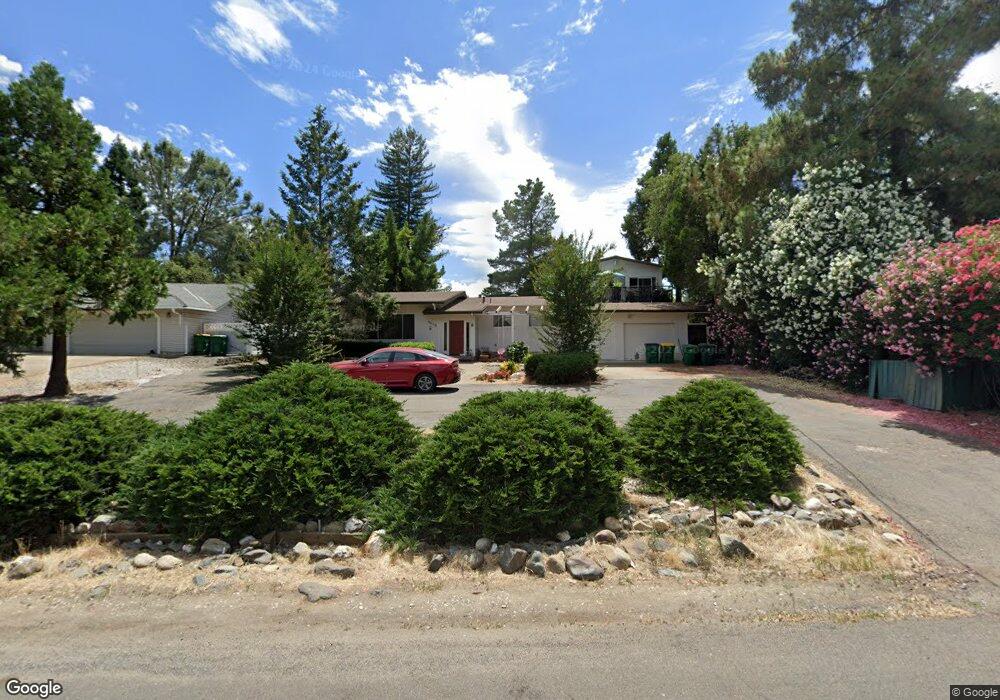
3870 Los Santos Dr Cameron Park, CA 95682
Estimated Value: $556,000 - $632,000
4
Beds
3
Baths
2,700
Sq Ft
$224/Sq Ft
Est. Value
About This Home
This home is located at 3870 Los Santos Dr, Cameron Park, CA 95682 and is currently estimated at $605,048, approximately $224 per square foot. 3870 Los Santos Dr is a home located in El Dorado County with nearby schools including Camerado Springs Middle School, Ponderosa High School, and California Montessori Project-Shingle Springs Campus.
Ownership History
Date
Name
Owned For
Owner Type
Purchase Details
Closed on
Jun 15, 2011
Sold by
Joshua Road Investments
Bought by
Macri Tony
Current Estimated Value
Home Financials for this Owner
Home Financials are based on the most recent Mortgage that was taken out on this home.
Original Mortgage
$189,981
Outstanding Balance
$130,167
Interest Rate
4.5%
Mortgage Type
FHA
Estimated Equity
$474,881
Purchase Details
Closed on
Feb 9, 2011
Sold by
Tatum James
Bought by
Joshua Road Investments
Purchase Details
Closed on
Apr 11, 2003
Sold by
Owen Herbert M and Owen Patricia Mibach
Bought by
Tatum James
Home Financials for this Owner
Home Financials are based on the most recent Mortgage that was taken out on this home.
Original Mortgage
$248,000
Interest Rate
6.75%
Create a Home Valuation Report for This Property
The Home Valuation Report is an in-depth analysis detailing your home's value as well as a comparison with similar homes in the area
Home Values in the Area
Average Home Value in this Area
Purchase History
| Date | Buyer | Sale Price | Title Company |
|---|---|---|---|
| Macri Tony | $198,000 | Placer Title Company | |
| Joshua Road Investments | $168,900 | None Available | |
| Tatum James | $310,000 | Fidelity Natl Title Co |
Source: Public Records
Mortgage History
| Date | Status | Borrower | Loan Amount |
|---|---|---|---|
| Open | Macri Tony | $189,981 | |
| Previous Owner | Tatum James | $248,000 | |
| Closed | Tatum James | $62,000 |
Source: Public Records
Tax History Compared to Growth
Tax History
| Year | Tax Paid | Tax Assessment Tax Assessment Total Assessment is a certain percentage of the fair market value that is determined by local assessors to be the total taxable value of land and additions on the property. | Land | Improvement |
|---|---|---|---|---|
| 2025 | $2,736 | $253,654 | $64,049 | $189,605 |
| 2024 | $2,736 | $248,682 | $62,794 | $185,888 |
| 2023 | $2,685 | $243,807 | $61,563 | $182,244 |
| 2022 | $2,647 | $239,027 | $60,356 | $178,671 |
| 2021 | $7,084 | $234,341 | $59,173 | $175,168 |
| 2020 | $7,049 | $231,939 | $58,567 | $173,372 |
| 2019 | $6,995 | $227,392 | $57,419 | $169,973 |
| 2018 | $6,931 | $222,935 | $56,294 | $166,641 |
| 2017 | $6,895 | $218,565 | $55,191 | $163,374 |
| 2016 | $2,395 | $214,280 | $54,109 | $160,171 |
| 2015 | $2,327 | $211,064 | $53,298 | $157,766 |
| 2014 | $2,327 | $206,932 | $52,255 | $154,677 |
Source: Public Records
Map
Nearby Homes
- 3844 Toronto Rd
- 3849 Fairway Dr
- 3681 Sudbury Rd
- 3844 Fairway Dr
- 3261 Amethyst Dr
- 3276 Topaz Ln
- 3222 Heights Dr
- 3264 Heights Dr
- 3489 Sudbury Rd
- 3073 Cedarhurst Ct
- 3076 Royal Dr
- 3980 Rustic Rd
- 3881 Rustic Rd
- 3834 Loma Dr
- 3590 Montclair Rd
- 3900 Loma Dr
- 3545 Montclair Rd
- 3583 Fairway Dr
- 3508 Fairway Dr
- 3038 Merrywood Cir
- 3878 Los Santos Dr
- 3862 Los Santos Dr
- 3778 Los Santos Dr
- 3770 Los Santos Dr
- 3856 Los Santos Dr
- 3886 Los Santos Dr
- 3786 Los Santos Dr
- 3867 Los Santos Dr
- 3792 Los Santos Dr
- 3883 Los Santos Dr
- 3762 Los Santos Dr
- 3861 Los Santos Dr
- 3848 Los Santos Dr
- 3892 Los Santos Dr
- 3891 Los Santos Dr
- 3800 Los Santos Dr
- 3754 Los Santos Dr
- 3853 Los Santos Dr
- 3777 Los Santos Dr
- 3785 Los Santos Dr