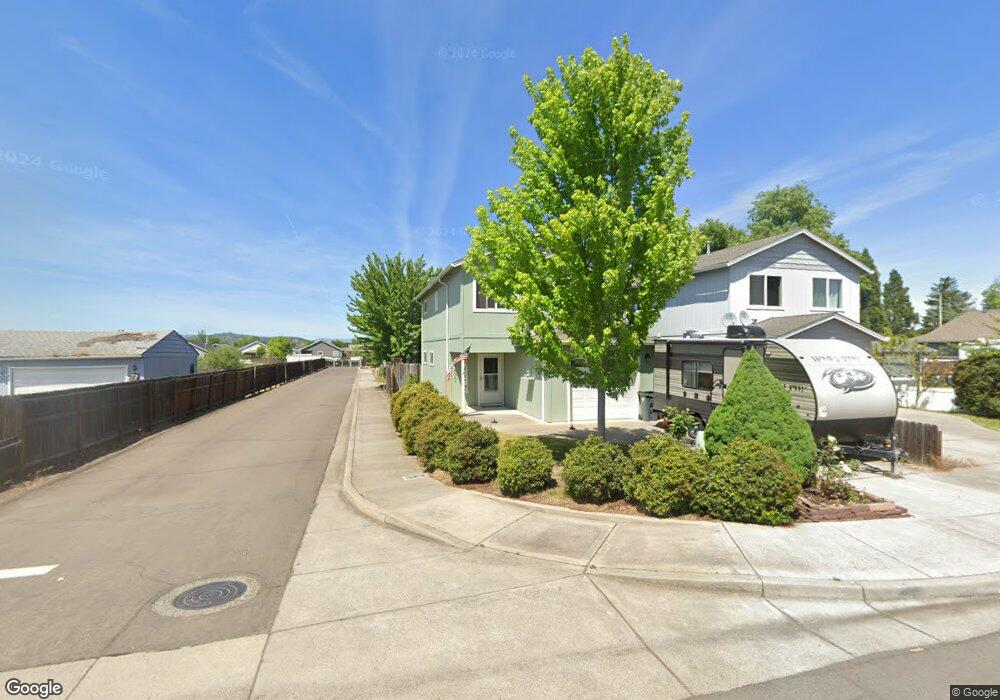
3877 Avenue C White City, OR 97503
Estimated Value: $297,048 - $346,000
3
Beds
2
Baths
1,440
Sq Ft
$221/Sq Ft
Est. Value
About This Home
This home is located at 3877 Avenue C, White City, OR 97503 and is currently estimated at $318,262, approximately $221 per square foot. 3877 Avenue C is a home located in Jackson County with nearby schools including Table Rock Elementary School, White Mountain Middle School, and Eagle Point Middle School.
Ownership History
Date
Name
Owned For
Owner Type
Purchase Details
Closed on
Aug 29, 2008
Sold by
Us Bank Na
Bought by
Paxton Nicholas Michael and Paxton Loretta Katherine
Current Estimated Value
Home Financials for this Owner
Home Financials are based on the most recent Mortgage that was taken out on this home.
Original Mortgage
$155,236
Outstanding Balance
$103,599
Interest Rate
6.59%
Mortgage Type
FHA
Estimated Equity
$214,663
Purchase Details
Closed on
Jun 16, 2008
Sold by
Madsen Jacob B
Bought by
Us Bank Na and Structured Asset Securities Corp Series
Purchase Details
Closed on
Sep 7, 2005
Sold by
Hildreth & Graham Homes Llc
Bought by
Madsen Jacob B
Home Financials for this Owner
Home Financials are based on the most recent Mortgage that was taken out on this home.
Original Mortgage
$183,900
Interest Rate
7%
Mortgage Type
Fannie Mae Freddie Mac
Create a Home Valuation Report for This Property
The Home Valuation Report is an in-depth analysis detailing your home's value as well as a comparison with similar homes in the area
Home Values in the Area
Average Home Value in this Area
Purchase History
| Date | Buyer | Sale Price | Title Company |
|---|---|---|---|
| Paxton Nicholas Michael | $156,900 | Fa | |
| Us Bank Na | $147,200 | Fa | |
| Madsen Jacob B | $229,900 | Lawyers Title Insurance Corp |
Source: Public Records
Mortgage History
| Date | Status | Borrower | Loan Amount |
|---|---|---|---|
| Open | Paxton Nicholas Michael | $155,236 | |
| Previous Owner | Madsen Jacob B | $183,900 |
Source: Public Records
Tax History Compared to Growth
Tax History
| Year | Tax Paid | Tax Assessment Tax Assessment Total Assessment is a certain percentage of the fair market value that is determined by local assessors to be the total taxable value of land and additions on the property. | Land | Improvement |
|---|---|---|---|---|
| 2025 | $2,043 | $147,520 | $45,000 | $102,520 |
| 2024 | $2,043 | $143,230 | $43,700 | $99,530 |
| 2023 | $1,974 | $139,060 | $42,430 | $96,630 |
| 2022 | $1,920 | $139,060 | $42,430 | $96,630 |
| 2021 | $1,863 | $135,010 | $41,190 | $93,820 |
| 2020 | $1,977 | $131,080 | $39,980 | $91,100 |
| 2019 | $1,947 | $123,570 | $37,690 | $85,880 |
| 2018 | $1,900 | $119,980 | $36,590 | $83,390 |
| 2017 | $1,852 | $119,980 | $36,590 | $83,390 |
| 2016 | $1,808 | $113,100 | $34,500 | $78,600 |
| 2015 | $1,733 | $113,100 | $34,500 | $78,600 |
| 2014 | $1,687 | $106,620 | $32,520 | $74,100 |
Source: Public Records
Map
Nearby Homes
- 3885 Avenue C
- 7793 Fallbrook Ln
- 7843 Cadence Ln
- 7894 Laura Ln
- 7540 Rocio Dr
- 3501 Avenue C Unit SPC 35
- 7973 Isabella Way
- 3765 Nicholas Way
- 7865 Houston Loop
- 7871 Houston Loop
- 7875 Houston Loop
- 7834 Phaedra Ln
- 7858 Phaedra Ln
- 7870 Phaedra Ln
- 3775 Agate Meadows Ct
- 7880 Phaedra Ln
- 7837 Phaedra Ln
- 3732 Agate Meadows Ct
- 7927 Wilson Way
- 3444 Sonny Way Unit lots 30-41
- 3879 Avenue C
- 7800 Fallbrook Ln
- 3881 Avenue C
- 7804 Fallbrook Ln
- 3875 Avenue C
- 7796 Fallbrook Ln
- 7808 Fallbrook Ln
- 7797 Fallbrook Ln
- 7741 Atlantic Ave
- 7816 Fallbrook Ln
- 7792 Fallbrook Ln
- 7812 Fallbrook Ln
- 7282 30th St
- 3930 Avenue C
- 7246 30th St
- 7833 Atlantic Ave
- 7226 30th St
- 3855 Avenue C
- 7076 30th St
- 7090 30th St