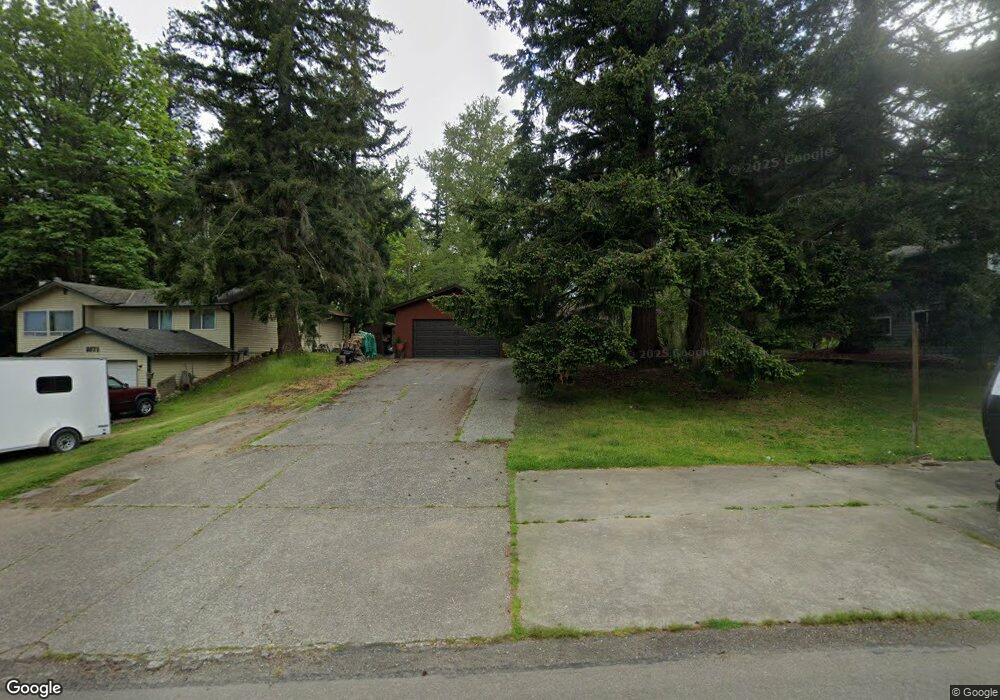
3877 Cindy Ln Bellingham, WA 98226
Estimated Value: $599,000 - $832,000
4
Beds
3
Baths
1,096
Sq Ft
$647/Sq Ft
Est. Value
About This Home
This home is located at 3877 Cindy Ln, Bellingham, WA 98226 and is currently estimated at $709,122, approximately $647 per square foot. 3877 Cindy Ln is a home located in Whatcom County with nearby schools including Northern Heights Elementary School, Shuksan Middle School, and Squalicum High School.
Ownership History
Date
Name
Owned For
Owner Type
Purchase Details
Closed on
Mar 12, 2003
Sold by
Joba Mark L
Bought by
Schuessler Carl M
Current Estimated Value
Home Financials for this Owner
Home Financials are based on the most recent Mortgage that was taken out on this home.
Original Mortgage
$148,000
Outstanding Balance
$62,217
Interest Rate
5.82%
Estimated Equity
$646,905
Purchase Details
Closed on
May 1, 2000
Sold by
The Bank Of New York
Bought by
Joba Mark L
Home Financials for this Owner
Home Financials are based on the most recent Mortgage that was taken out on this home.
Original Mortgage
$138,855
Interest Rate
8.22%
Mortgage Type
FHA
Purchase Details
Closed on
Feb 4, 2000
Sold by
Tomlinson Wayne R
Bought by
The Bank Of New York
Create a Home Valuation Report for This Property
The Home Valuation Report is an in-depth analysis detailing your home's value as well as a comparison with similar homes in the area
Home Values in the Area
Average Home Value in this Area
Purchase History
| Date | Buyer | Sale Price | Title Company |
|---|---|---|---|
| Schuessler Carl M | $159,016 | Stewart Title Company | |
| Joba Mark L | $140,000 | Chicago Title Insurance Co | |
| The Bank Of New York | $98,277 | Chicago Title Insurance Co |
Source: Public Records
Mortgage History
| Date | Status | Borrower | Loan Amount |
|---|---|---|---|
| Open | Schuessler Carl M | $148,000 | |
| Previous Owner | Joba Mark L | $138,855 | |
| Closed | Schuessler Carl M | $27,700 |
Source: Public Records
Tax History Compared to Growth
Tax History
| Year | Tax Paid | Tax Assessment Tax Assessment Total Assessment is a certain percentage of the fair market value that is determined by local assessors to be the total taxable value of land and additions on the property. | Land | Improvement |
|---|---|---|---|---|
| 2024 | $5,342 | $590,871 | $228,096 | $362,775 |
| 2023 | $5,342 | $616,859 | $238,128 | $378,731 |
| 2022 | $4,265 | $501,511 | $193,600 | $307,911 |
| 2021 | $4,315 | $414,472 | $160,000 | $254,472 |
| 2020 | $4,140 | $394,484 | $143,308 | $251,176 |
| 2019 | $3,620 | $368,582 | $133,998 | $234,584 |
| 2018 | $3,753 | $330,594 | $120,198 | $210,396 |
| 2017 | $3,268 | $292,513 | $106,352 | $186,161 |
| 2016 | $3,019 | $265,853 | $96,784 | $169,069 |
| 2015 | $3,011 | $253,248 | $92,000 | $161,248 |
| 2014 | -- | $245,661 | $87,720 | $157,941 |
| 2013 | -- | $235,384 | $85,000 | $150,384 |
Source: Public Records
Map
Nearby Homes
- 3871 Cindy Ln
- 1580 Hillsdale Rd
- 3785 Greenville Place
- 1430 Welling Rd
- 1368 Roma Rd
- 1379 Northwood Ct
- 1812 Squalicum Mountain Rd
- 3666 Woodlake Rd
- 4121 Malachite Dr
- 1314 Welling Rd
- 4136 Malachite Dr
- 1756 Emerald Lake Way
- 1668 Sapphire Trail
- 4055 Springland Ct
- 2933 Toad Lake Rd
- 4431 Alice St
- 3827 Keystone Way
- 4220 Brays Way
- 4414 Alice St
- 3606 Tree Farm Ct
- 3883 Cindy Ln
- 3865 Cindy Ln
- 3889 Cindy Ln
- 3876 Cindy Ln
- 3882 Cindy Ln
- 3870 Cindy Ln
- 3859 Cindy Ln
- 3895 Cindy Ln
- 3888 Cindy Ln
- 3938 Cindy Ln
- 3864 Cindy Ln
- 3894 Cindy Ln
- 3851 Cindy Ln
- 3858 Cindy Ln
- 3875 Brownsville Dr
- 3887 Brownsville Dr
- 3869 Brownsville Dr
- 3881 Brownsville Dr
- 3854 Britton Rd
- 3863 Brownsville Dr