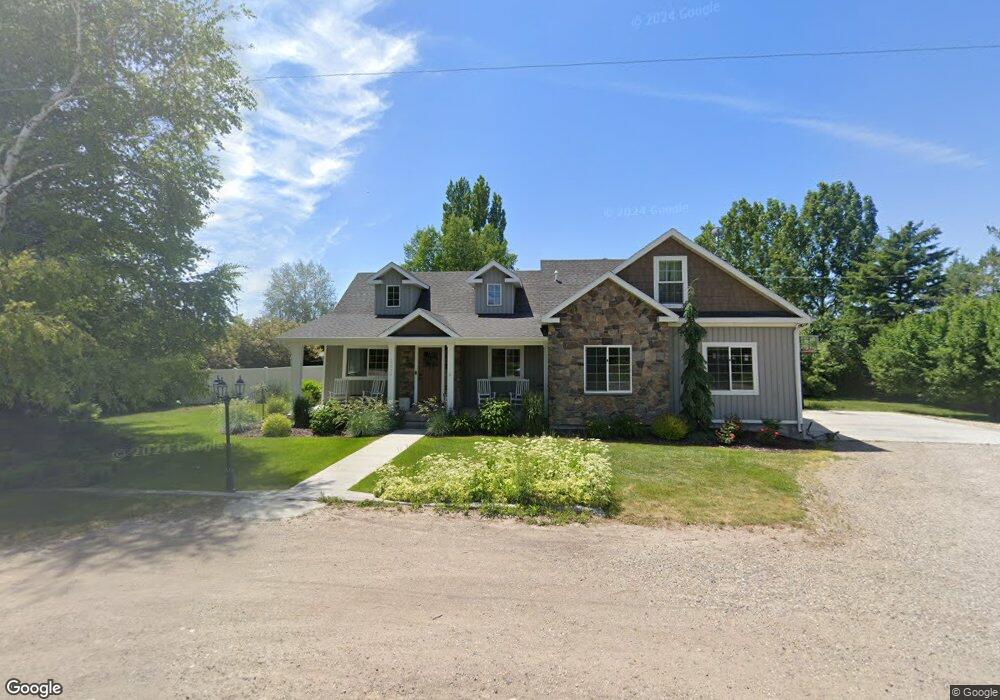
3879 S 4300 W Rexburg, ID 83440
Estimated Value: $444,000 - $766,000
2
Beds
1
Bath
2,339
Sq Ft
$279/Sq Ft
Est. Value
About This Home
This home is located at 3879 S 4300 W, Rexburg, ID 83440 and is currently estimated at $652,604, approximately $279 per square foot. 3879 S 4300 W is a home located in Madison County with nearby schools including Burton Elementary School, Kennedy Elementary School, and Madison Junior High School.
Ownership History
Date
Name
Owned For
Owner Type
Purchase Details
Closed on
Sep 8, 2020
Sold by
Price Joshua Knight and Price Amanda Rothwell
Bought by
Price Joshua K and Price Amanda R
Current Estimated Value
Home Financials for this Owner
Home Financials are based on the most recent Mortgage that was taken out on this home.
Original Mortgage
$243,500
Outstanding Balance
$215,689
Interest Rate
2.8%
Mortgage Type
New Conventional
Estimated Equity
$436,915
Purchase Details
Closed on
Aug 6, 2012
Sold by
Reeser Brenda
Bought by
Price Joshua Knight and Price Amanda Rothwell
Create a Home Valuation Report for This Property
The Home Valuation Report is an in-depth analysis detailing your home's value as well as a comparison with similar homes in the area
Home Values in the Area
Average Home Value in this Area
Purchase History
| Date | Buyer | Sale Price | Title Company |
|---|---|---|---|
| Price Joshua K | -- | First American Title Rexburg | |
| Price Joshua Knight | -- | -- |
Source: Public Records
Mortgage History
| Date | Status | Borrower | Loan Amount |
|---|---|---|---|
| Open | Price Joshua K | $243,500 |
Source: Public Records
Tax History Compared to Growth
Tax History
| Year | Tax Paid | Tax Assessment Tax Assessment Total Assessment is a certain percentage of the fair market value that is determined by local assessors to be the total taxable value of land and additions on the property. | Land | Improvement |
|---|---|---|---|---|
| 2025 | $3,346 | $612,021 | $219,254 | $392,767 |
| 2024 | $3,346 | $612,021 | $219,254 | $392,767 |
| 2023 | $3,346 | $462,635 | $81,600 | $381,035 |
| 2022 | $3,152 | $437,302 | $68,000 | $369,302 |
| 2021 | $2,965 | $371,926 | $49,400 | $322,526 |
| 2020 | $2,574 | $313,926 | $41,900 | $272,026 |
| 2019 | $2,502 | $281,791 | $41,900 | $239,891 |
| 2018 | $2,199 | $258,837 | $41,900 | $216,937 |
| 2017 | $2,052 | $247,359 | $41,900 | $205,459 |
| 2016 | $2,078 | $244,859 | $39,400 | $205,459 |
| 2015 | $1,044 | $221,904 | $0 | $0 |
| 2013 | -- | $129,130 | $0 | $0 |
Source: Public Records
Map
Nearby Homes
- Ashland Plan at Harvest Estates
- Westbrook Plan at Harvest Estates
- Berrington Plan at Harvest Estates
- Denford Plan at Harvest Estates
- Milton Plan at Harvest Estates
- Foxhill Plan at Harvest Estates
- Edgeworth Plan at Harvest Estates
- Hadleigh Plan at Harvest Estates
- Brantwood Plan at Harvest Estates
- Norfolk Plan at Harvest Estates
- Vanbrough Plan at Harvest Estates
- Xavier Plan at Harvest Estates
- Cambria Plan at Harvest Estates
- Stanton Plan at Harvest Estates
- Canyon Plan at Harvest Estates
- Kensington Plan at Harvest Estates
- Hyland Plan at Harvest Estates
- Ravenstone Plan at Harvest Estates
- Aldin Plan at Harvest Estates
- Townsend Plan at Harvest Estates