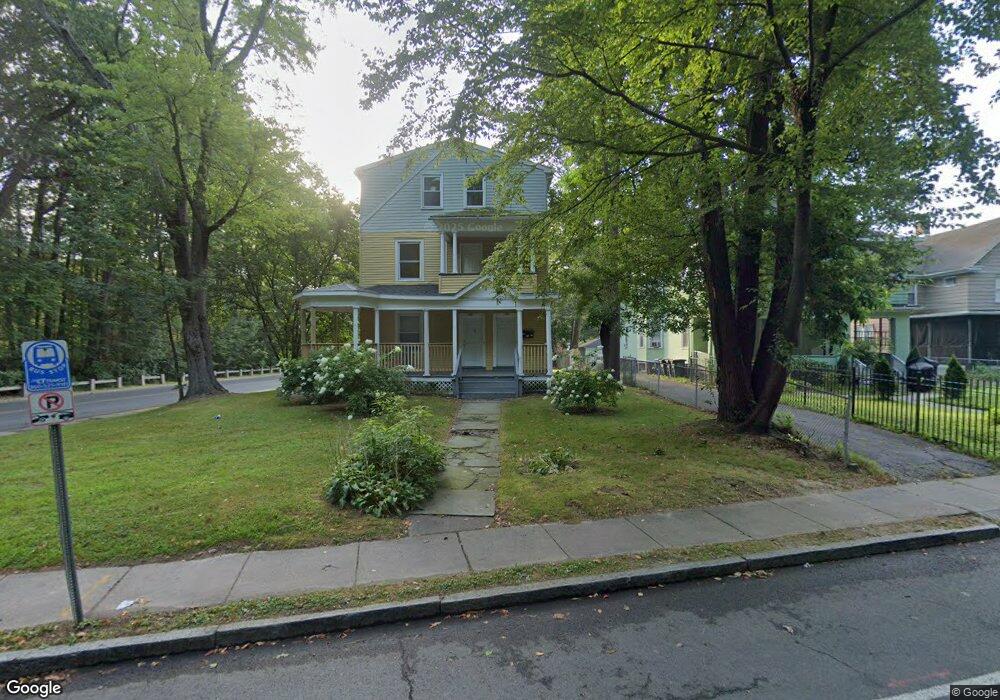
388 Vine St Unit 390 Hartford, CT 06112
North End NeighborhoodEstimated Value: $182,396 - $402,000
6
Beds
3
Baths
3,372
Sq Ft
$101/Sq Ft
Est. Value
About This Home
This home is located at 388 Vine St Unit 390, Hartford, CT 06112 and is currently estimated at $341,849, approximately $101 per square foot. 388 Vine St Unit 390 is a home located in Hartford County with nearby schools including Capital Preparatory Magnet School, Perry Elementary School, and Ib Global Communications Academy.
Ownership History
Date
Name
Owned For
Owner Type
Purchase Details
Closed on
Nov 17, 2016
Sold by
Bruce Marjorie
Bought by
Hitech Properties Llc
Current Estimated Value
Home Financials for this Owner
Home Financials are based on the most recent Mortgage that was taken out on this home.
Original Mortgage
$80,000
Outstanding Balance
$64,054
Interest Rate
3.42%
Mortgage Type
New Conventional
Estimated Equity
$277,796
Create a Home Valuation Report for This Property
The Home Valuation Report is an in-depth analysis detailing your home's value as well as a comparison with similar homes in the area
Home Values in the Area
Average Home Value in this Area
Purchase History
| Date | Buyer | Sale Price | Title Company |
|---|---|---|---|
| Hitech Properties Llc | $101,000 | -- |
Source: Public Records
Mortgage History
| Date | Status | Borrower | Loan Amount |
|---|---|---|---|
| Open | Hitech Properties Llc | $80,000 | |
| Previous Owner | Hitech Properties Llc | $95,000 | |
| Previous Owner | Hitech Properties Llc | $95,000 |
Source: Public Records
Tax History Compared to Growth
Tax History
| Year | Tax Paid | Tax Assessment Tax Assessment Total Assessment is a certain percentage of the fair market value that is determined by local assessors to be the total taxable value of land and additions on the property. | Land | Improvement |
|---|---|---|---|---|
| 2025 | $5,891 | $85,444 | $4,961 | $80,483 |
| 2024 | $5,891 | $85,444 | $4,961 | $80,483 |
| 2023 | $5,891 | $85,444 | $4,961 | $80,483 |
| 2022 | $5,891 | $85,444 | $4,961 | $80,483 |
| 2021 | $3,640 | $49,000 | $4,340 | $44,660 |
| 2020 | $3,640 | $49,000 | $4,340 | $44,660 |
| 2019 | $3,640 | $49,000 | $4,340 | $44,660 |
| 2018 | $3,517 | $47,348 | $4,194 | $43,154 |
| 2016 | $3,403 | $45,803 | $3,994 | $41,809 |
| 2015 | $3,241 | $43,627 | $3,804 | $39,823 |
| 2014 | $3,162 | $42,560 | $3,711 | $38,849 |
Source: Public Records
Map
Nearby Homes
- 275 Westland St
- 238 Enfield St Unit 240
- 158 Martin St Unit 160
- 50 Mansfield St
- 87 Mansfield St Unit 89
- 37 Martin St
- 147 Enfield St Unit 149
- 59 Mansfield St Unit 61
- 25 Judson St Unit C
- 33 E Raymond St Unit 35
- 142 Clark St
- 141 Greenfield St
- 83 Colebrook St Unit 85
- 67 Enfield St Unit 37
- 68 Enfield St Unit 70
- 211 Holcomb St Unit 213
- 102 Thomaston St Unit 104
- 218 Holcomb St Unit 220
- 39 Capen St
- 109 Blue Hills Ave
- 390 Vine St
- 384 Vine St Unit 386
- 382 Vine St
- 307 Westland St Unit 309
- 307 Westland St
- 307 Westland St Unit 1
- 378 Vine St
- 303 Westland St Unit 305
- 374 Vine St
- 297 Westland St Unit 299
- 295 Westland St
- 368 Vine St Unit 370
- 293 Westland St Unit 295
- 364 Vine St Unit 366
- 289 Westland St Unit 291
- 360 Vine St Unit 362
- 16 Winchester St Unit 18
- 12 Winchester St Unit 14
- 285 Westland St Unit A1
- 285 Westland St Unit A4