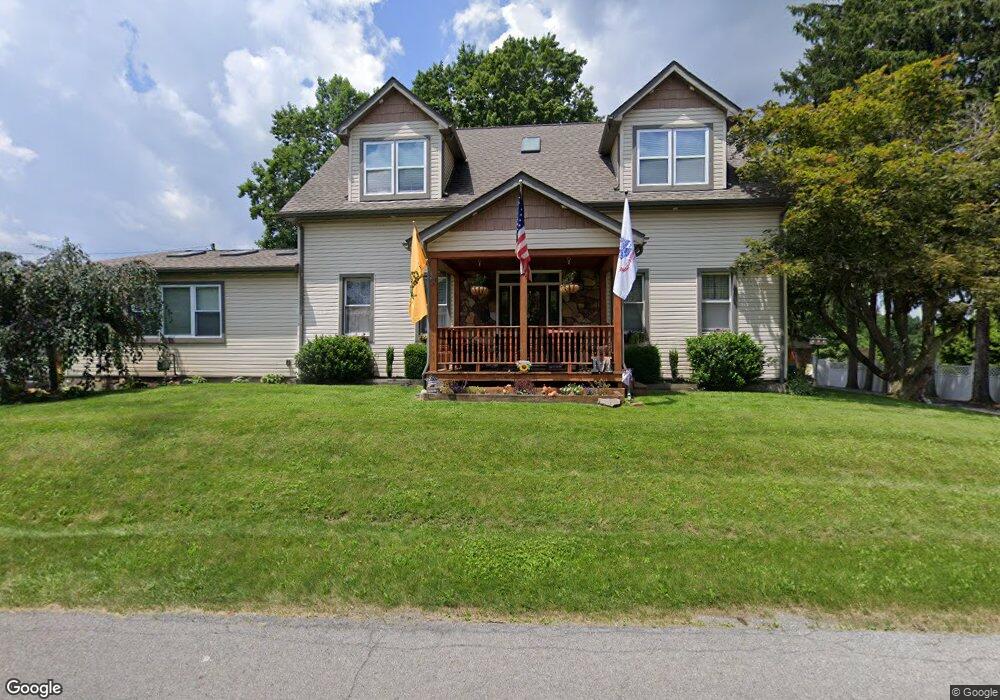
3895 W Washington St New Castle, PA 16101
Estimated Value: $215,493 - $349,000
2
Beds
1
Bath
3,060
Sq Ft
$88/Sq Ft
Est. Value
About This Home
This home is located at 3895 W Washington St, New Castle, PA 16101 and is currently estimated at $269,873, approximately $88 per square foot. 3895 W Washington St is a home located in Lawrence County with nearby schools including Union Memorial Elementary School, Union Area High School, and St. Vitus School.
Ownership History
Date
Name
Owned For
Owner Type
Purchase Details
Closed on
Feb 18, 2017
Sold by
Salvatore Rochelle A
Bought by
Salvatore Rochelle A and Moyer David
Current Estimated Value
Purchase Details
Closed on
Jun 9, 2014
Sold by
Salvatore Daniel A and Salvatore Rochelle A
Bought by
Salvatore Rochelle A
Purchase Details
Closed on
Oct 17, 2008
Sold by
Sickafuse William and Sickafuse Carol
Bought by
Salvatore Daniel A and Salvatore Rochelle A
Home Financials for this Owner
Home Financials are based on the most recent Mortgage that was taken out on this home.
Original Mortgage
$64,311
Outstanding Balance
$42,724
Interest Rate
6.41%
Mortgage Type
FHA
Estimated Equity
$227,149
Purchase Details
Closed on
May 9, 2008
Sold by
Federal National Mortgage Association
Bought by
Sickafuse William D and Blackstock Raymond W
Purchase Details
Closed on
Oct 1, 2007
Sold by
Haybarger Debra J and Haybarger Ronald K
Bought by
Fannie Mae
Create a Home Valuation Report for This Property
The Home Valuation Report is an in-depth analysis detailing your home's value as well as a comparison with similar homes in the area
Home Values in the Area
Average Home Value in this Area
Purchase History
| Date | Buyer | Sale Price | Title Company |
|---|---|---|---|
| Salvatore Rochelle A | $19,291 | None Available | |
| Salvatore Rochelle A | -- | None Available | |
| Salvatore Daniel A | $65,000 | None Available | |
| Sickafuse William D | $32,000 | None Available | |
| Fannie Mae | $1,231 | None Available |
Source: Public Records
Mortgage History
| Date | Status | Borrower | Loan Amount |
|---|---|---|---|
| Open | Salvatore Daniel A | $64,311 |
Source: Public Records
Tax History Compared to Growth
Tax History
| Year | Tax Paid | Tax Assessment Tax Assessment Total Assessment is a certain percentage of the fair market value that is determined by local assessors to be the total taxable value of land and additions on the property. | Land | Improvement |
|---|---|---|---|---|
| 2025 | $3,471 | $111,400 | $19,300 | $92,100 |
| 2024 | $3,336 | $111,400 | $19,300 | $92,100 |
| 2023 | $3,238 | $111,400 | $19,300 | $92,100 |
| 2022 | $3,179 | $115,300 | $19,300 | $96,000 |
| 2021 | $3,179 | $115,300 | $19,300 | $96,000 |
| 2020 | $1,850 | $67,100 | $19,300 | $47,800 |
| 2019 | $1,766 | $67,100 | $19,300 | $47,800 |
| 2018 | $1,766 | $67,100 | $19,300 | $47,800 |
| 2017 | $1,712 | $67,100 | $19,300 | $47,800 |
| 2016 | $622 | $67,100 | $19,300 | $47,800 |
| 2015 | $622 | $67,100 | $19,300 | $47,800 |
| 2014 | $622 | $67,100 | $19,300 | $47,800 |
Source: Public Records
Map
Nearby Homes
- 468 Mccombs Cir
- 3996 W Washington St
- 804 Barbra Ln Unit 13D
- 67 Ida Dr
- 454 Mountain View Rd
- 179 Frenz Dr
- 16 Coates Ave
- 289 Scotland Ln
- 0000 Harbor Rd
- 1750 Harbor Edinburg Rd
- 486 Scotland Ln
- 126 Cecil Ave
- 1761 Old Youngstown Rd
- 660 Kingdom Dr
- 571 Harbor Edinburg Rd
- 1920 Robinwood St
- 1013 Charles Dr
- 1422 Johnson St
- 401 Grandview Ave
- 1502 Herrick St
- 3875 W Washington St
- 3927 W Washington St
- 3904 W Washington St
- 3884 W Washington St
- 153 Penny Ln
- 179 Penny Ln
- 3832 W Washington St
- 579 Mccombs Cir
- 217 Wallace Cir
- 3981 W Washington St
- 229 Wallace Cir
- 545 Mccombs Cir
- 109 Mccombs Cir
- 195 Wallace Cir
- 203 Warren Dr
- 182 Abbey Ln
- 3999 W Washington St
- 181 Wallace Cir
- 527 Mccombs Cir
- 245 Wallace Cir