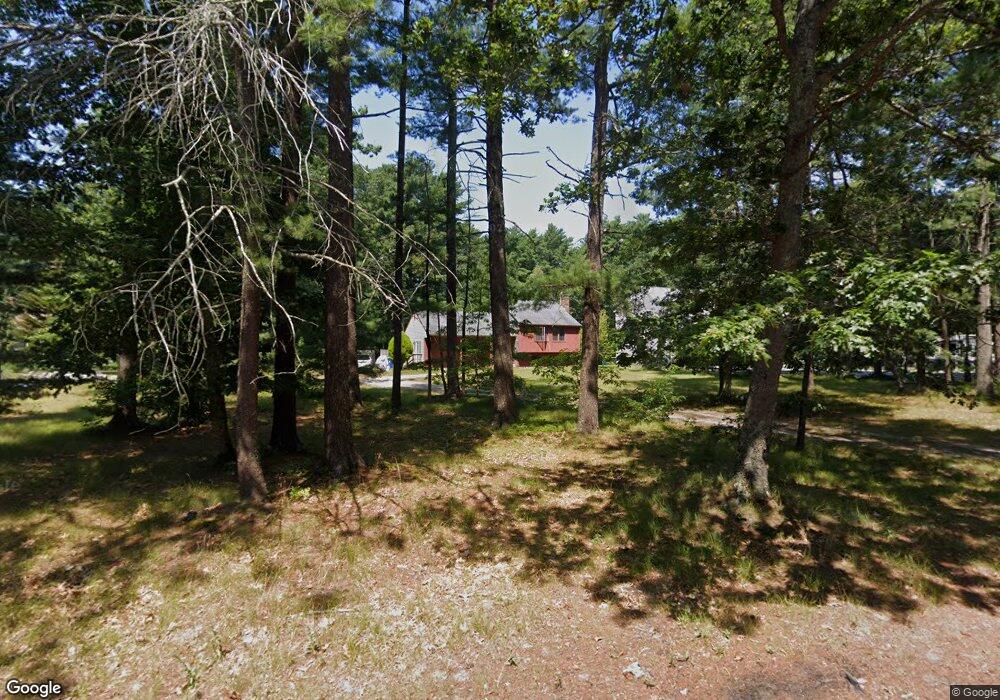
39 Pinewood Rd Plymouth, MA 02360
Estimated Value: $584,000 - $636,000
3
Beds
1
Bath
1,770
Sq Ft
$339/Sq Ft
Est. Value
About This Home
This home is located at 39 Pinewood Rd, Plymouth, MA 02360 and is currently estimated at $600,507, approximately $339 per square foot. 39 Pinewood Rd is a home located in Plymouth County with nearby schools including West Elementary School, Plymouth Community Intermediate, and Plymouth North High School.
Ownership History
Date
Name
Owned For
Owner Type
Purchase Details
Closed on
Aug 16, 2023
Sold by
Connolly James M and Connolly Pamela E
Bought by
Connolly Ft and Connolly
Current Estimated Value
Purchase Details
Closed on
Aug 14, 1998
Sold by
Harris Kenneth S and Harris Mary S
Bought by
Connolly James M and Connolly Pamela E
Purchase Details
Closed on
Jul 20, 1987
Sold by
Titus Harold N
Bought by
Harrris Kenneth S
Create a Home Valuation Report for This Property
The Home Valuation Report is an in-depth analysis detailing your home's value as well as a comparison with similar homes in the area
Home Values in the Area
Average Home Value in this Area
Purchase History
| Date | Buyer | Sale Price | Title Company |
|---|---|---|---|
| Connolly Ft | -- | None Available | |
| Connolly James M | $143,000 | -- | |
| Harrris Kenneth S | $150,000 | -- |
Source: Public Records
Mortgage History
| Date | Status | Borrower | Loan Amount |
|---|---|---|---|
| Previous Owner | Harrris Kenneth S | $245,000 | |
| Previous Owner | Harrris Kenneth S | $43,000 | |
| Previous Owner | Harrris Kenneth S | $190,000 |
Source: Public Records
Tax History Compared to Growth
Tax History
| Year | Tax Paid | Tax Assessment Tax Assessment Total Assessment is a certain percentage of the fair market value that is determined by local assessors to be the total taxable value of land and additions on the property. | Land | Improvement |
|---|---|---|---|---|
| 2025 | $6,011 | $473,700 | $240,600 | $233,100 |
| 2024 | $5,837 | $453,500 | $228,600 | $224,900 |
| 2023 | $5,775 | $421,200 | $208,600 | $212,600 |
| 2022 | $5,269 | $341,500 | $188,200 | $153,300 |
| 2021 | $5,158 | $319,200 | $188,200 | $131,000 |
| 2020 | $5,015 | $306,700 | $178,200 | $128,500 |
| 2019 | $4,742 | $286,700 | $158,200 | $128,500 |
| 2018 | $4,512 | $274,100 | $148,200 | $125,900 |
| 2017 | $4,380 | $264,200 | $148,200 | $116,000 |
| 2016 | $4,217 | $259,200 | $143,200 | $116,000 |
| 2015 | $3,950 | $254,200 | $138,200 | $116,000 |
| 2014 | $3,716 | $245,600 | $138,200 | $107,400 |
Source: Public Records
Map
Nearby Homes
- 235 Carver Rd Unit 7
- 19 Coachman Terrace
- 17 Lydia Dr
- 14 Amy Ln
- 37 Flintlocke Dr
- 49 Snowgoose Ln
- 50 Pinehurst Dr
- 6 Deer Hill Ln
- 55 Pinehurst Dr
- 2 Candlelight Dr
- 9 Lawrence Rd
- 85 Narragansett Dr
- 166 Carver Rd
- 7 Sansome St
- 16 Filmore St
- 6 Stone Gate Dr
- 16 Matthews Trail
- 25 Harvard Dr
- 3 Alec Ln
- 52 W Pond Rd