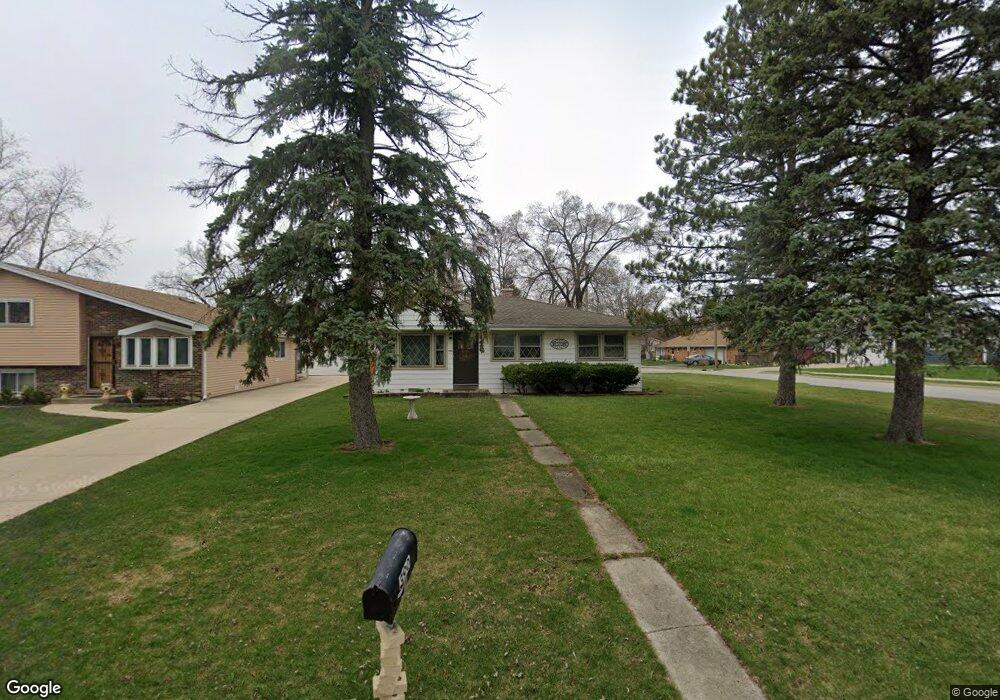
390 N Elmwood Ave Wood Dale, IL 60191
Estimated Value: $176,000 - $326,000
--
Bed
--
Bath
1,015
Sq Ft
$262/Sq Ft
Est. Value
About This Home
This home is located at 390 N Elmwood Ave, Wood Dale, IL 60191 and is currently estimated at $265,836, approximately $261 per square foot. 390 N Elmwood Ave is a home located in DuPage County with nearby schools including Oakbrook Elementary School, Westview Elementary School, and Wood Dale Junior High School.
Ownership History
Date
Name
Owned For
Owner Type
Purchase Details
Closed on
Mar 30, 2012
Sold by
Grozdic Ray
Bought by
R & M Holdings I Llc
Current Estimated Value
Purchase Details
Closed on
Nov 28, 2000
Sold by
Grozdich Mike M
Bought by
Grozdich Ray
Purchase Details
Closed on
Jul 30, 1999
Sold by
Wachowicz Richard and Wachowicz Frank
Bought by
Rodriguez Elena and Velasquez Helmer
Home Financials for this Owner
Home Financials are based on the most recent Mortgage that was taken out on this home.
Original Mortgage
$165,133
Interest Rate
8.21%
Mortgage Type
FHA
Purchase Details
Closed on
Oct 29, 1993
Sold by
Hanket Grace and Nelson Charlotte
Bought by
Ingold Nancy
Home Financials for this Owner
Home Financials are based on the most recent Mortgage that was taken out on this home.
Original Mortgage
$92,900
Interest Rate
7%
Mortgage Type
Purchase Money Mortgage
Create a Home Valuation Report for This Property
The Home Valuation Report is an in-depth analysis detailing your home's value as well as a comparison with similar homes in the area
Home Values in the Area
Average Home Value in this Area
Purchase History
| Date | Buyer | Sale Price | Title Company |
|---|---|---|---|
| R & M Holdings I Llc | -- | None Available | |
| Grozdich Ray | -- | -- | |
| Rodriguez Elena | $166,500 | -- | |
| Ingold Nancy | $108,000 | First American Title Insuran |
Source: Public Records
Mortgage History
| Date | Status | Borrower | Loan Amount |
|---|---|---|---|
| Previous Owner | Rodriguez Elena | $165,133 | |
| Previous Owner | Ingold Nancy | $92,900 |
Source: Public Records
Tax History Compared to Growth
Tax History
| Year | Tax Paid | Tax Assessment Tax Assessment Total Assessment is a certain percentage of the fair market value that is determined by local assessors to be the total taxable value of land and additions on the property. | Land | Improvement |
|---|---|---|---|---|
| 2024 | $5,239 | $72,839 | $30,741 | $42,098 |
| 2023 | $4,935 | $66,960 | $28,260 | $38,700 |
| 2022 | $4,804 | $64,060 | $27,030 | $37,030 |
| 2021 | $4,570 | $61,360 | $25,890 | $35,470 |
| 2020 | $4,283 | $58,770 | $24,800 | $33,970 |
| 2019 | $4,167 | $56,510 | $23,850 | $32,660 |
| 2018 | $3,657 | $55,150 | $23,370 | $31,780 |
| 2017 | $3,528 | $52,710 | $22,340 | $30,370 |
| 2016 | $3,351 | $48,670 | $20,630 | $28,040 |
| 2015 | $3,227 | $44,960 | $19,060 | $25,900 |
| 2014 | $3,418 | $47,060 | $19,660 | $27,400 |
| 2013 | $3,403 | $48,020 | $20,060 | $27,960 |
Source: Public Records
Map
Nearby Homes
- 401 N Wood Dale Rd
- 341 Oak Ave
- 337 Oak Ave
- 454 N Cedar Ave
- 294 Oak Ave
- 128 W Irving Park Rd
- 367 Catalpa Ave
- 142 School St
- 456 Grove St
- 317 N Central Ave
- 130 E Potter St
- 236 Oakwood Dr
- 373 N Hemlock Ave
- 17W508 Hawthorne Ave
- 171 N Elmwood Ave
- 259 Pine Ln
- 174 Ash Ave
- 213 Hiawatha Trail
- 139 N Hemlock Ave
- 249 N Addison Rd
- 386 N Elmwood Ave
- 384 N Elmwood Ave
- 400 N Elmwood Ave
- 380 N Elmwood Ave
- 404 N Elmwood Ave
- 385 N Walnut Ave
- 391 N Walnut Ave
- 376 N Elmwood Ave
- 381 N Elmwood Ave
- 389 N Elmwood Ave
- 385 N Elmwood Ave
- 401 N Walnut Ave
- 379 N Walnut Ave
- 401 N Elmwood Ave
- 370 N Elmwood Ave
- 377 N Elmwood Ave
- 405 N Elmwood Ave
- 373 N Walnut Ave
- 407 N Walnut Ave
- 412 N Elmwood Ave