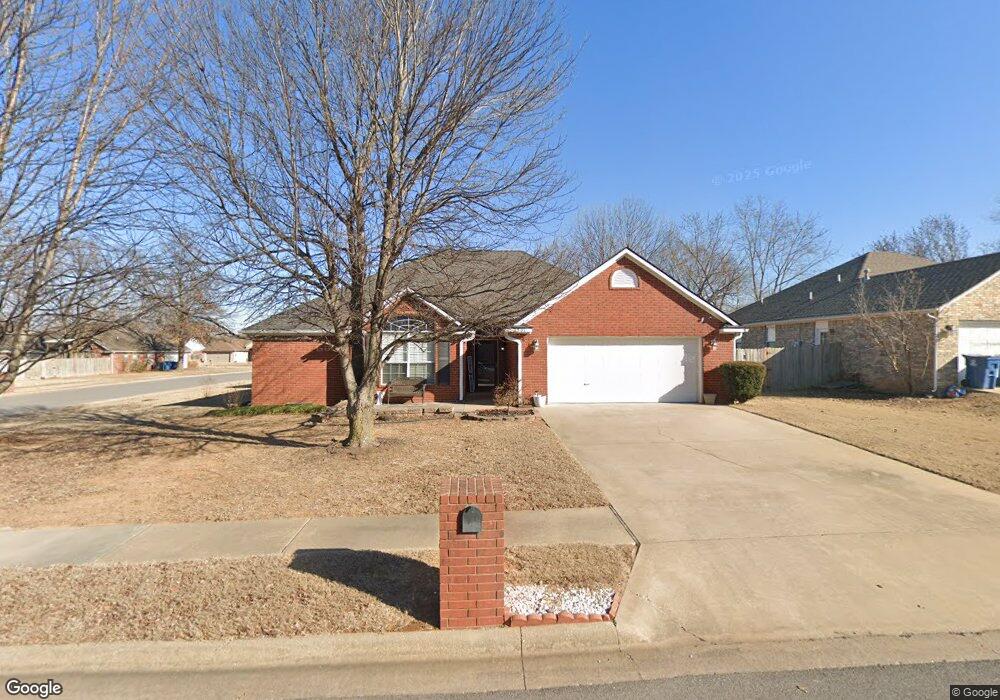
3901 SW Cherry Rd Bentonville, AR 72712
Estimated Value: $362,000 - $417,000
3
Beds
2
Baths
1,776
Sq Ft
$218/Sq Ft
Est. Value
About This Home
This home is located at 3901 SW Cherry Rd, Bentonville, AR 72712 and is currently estimated at $387,146, approximately $217 per square foot. 3901 SW Cherry Rd is a home located in Benton County with nearby schools including Bright Field Middle School, Willowbrook Elementary School, and Fulbright Junior High School.
Ownership History
Date
Name
Owned For
Owner Type
Purchase Details
Closed on
Apr 8, 2008
Sold by
Sirva Relocation Llc
Bought by
Stone Suzanne R
Current Estimated Value
Home Financials for this Owner
Home Financials are based on the most recent Mortgage that was taken out on this home.
Original Mortgage
$136,800
Outstanding Balance
$86,068
Interest Rate
5.84%
Estimated Equity
$301,078
Purchase Details
Closed on
Feb 20, 2008
Sold by
Jellen Gary G and Jellen Jill J
Bought by
Sirva Relocation Llc
Home Financials for this Owner
Home Financials are based on the most recent Mortgage that was taken out on this home.
Original Mortgage
$136,800
Outstanding Balance
$86,068
Interest Rate
5.84%
Estimated Equity
$301,078
Purchase Details
Closed on
Aug 31, 2004
Bought by
Jellen
Purchase Details
Closed on
Aug 24, 2004
Bought by
Jellen
Purchase Details
Closed on
Aug 16, 2000
Bought by
Estes
Purchase Details
Closed on
Jun 28, 2000
Bought by
Pinkley
Purchase Details
Closed on
Feb 8, 2000
Bought by
Pinkley
Create a Home Valuation Report for This Property
The Home Valuation Report is an in-depth analysis detailing your home's value as well as a comparison with similar homes in the area
Home Values in the Area
Average Home Value in this Area
Purchase History
| Date | Buyer | Sale Price | Title Company |
|---|---|---|---|
| Stone Suzanne R | $171,000 | None Available | |
| Sirva Relocation Llc | $166,000 | Stewart Title Guaranty Compa | |
| Jellen | $154,000 | -- | |
| Jellen | $154,000 | -- | |
| Estes | $110,000 | -- | |
| Pinkley | -- | -- | |
| Pinkley | $22,000 | -- |
Source: Public Records
Mortgage History
| Date | Status | Borrower | Loan Amount |
|---|---|---|---|
| Open | Stone Suzanne R | $136,800 | |
| Previous Owner | Sirva Relocation Llc | $136,800 |
Source: Public Records
Tax History Compared to Growth
Tax History
| Year | Tax Paid | Tax Assessment Tax Assessment Total Assessment is a certain percentage of the fair market value that is determined by local assessors to be the total taxable value of land and additions on the property. | Land | Improvement |
|---|---|---|---|---|
| 2025 | $2,263 | $58,924 | $15,600 | $43,324 |
| 2024 | $2,170 | $58,924 | $15,600 | $43,324 |
| 2023 | $2,067 | $39,340 | $8,000 | $31,340 |
| 2022 | $1,650 | $39,340 | $8,000 | $31,340 |
| 2021 | $1,552 | $39,340 | $8,000 | $31,340 |
| 2020 | $1,478 | $29,090 | $5,400 | $23,690 |
| 2019 | $1,478 | $29,090 | $5,400 | $23,690 |
| 2018 | $1,503 | $29,090 | $5,400 | $23,690 |
| 2017 | $1,445 | $29,090 | $5,400 | $23,690 |
| 2016 | $1,445 | $29,090 | $5,400 | $23,690 |
| 2015 | $1,756 | $28,420 | $9,500 | $18,920 |
| 2014 | $1,406 | $28,420 | $9,500 | $18,920 |
Source: Public Records
Map
Nearby Homes
- 1813 SW Pine Ave
- 4004 SW Banbury Dr
- 1602 SW Montrose Ave
- 2402 SW Aster Way
- 2303 SW Chinquapin Ave
- 1300 SW Willow Bend Ave
- 1812 SW Edinburgh Ave
- 4605 SW Barton St
- 4508 SW Birmingham St
- 4601 SW Hollowbrook St
- 2508 SW Nottingham Ave
- 4203 SW Lilac St
- 1204 SW Edinburgh Ave
- 1104 SW Edinburgh Ave
- 2603 SW Hampton Ave
- 2904 SW Little Elm Loop
- 4800 SW Blaire Mont Rd
- 4903 SW Newcastle Rd
- 1202 SW Westbury Place
- 5000 SW Blaire Mont Rd
- 3903 SW Cherry Rd
- 3902 SW Maple Rd
- 3905 SW Cherry Rd
- 2001 SW Fir Ave
- 1902 SW Fir Ave
- 1904 SW Fir Ave
- 3804 SW Maple Rd
- 3904 SW Maple Rd
- 3902 SW Cherry Rd
- 2000 SW Fir Ave
- 3907 SW Cherry Rd
- 2003 SW Fir Ave
- 3904 SW Cherry Rd
- 3802 SW Maple Rd
- 3906 SW Maple Rd
- Lot S Cherry Rd
- Lot N Cherry Rd
- 2002 SW Fir Ave
- 3901 SW Maple Rd
- 3809 SW Maple Rd