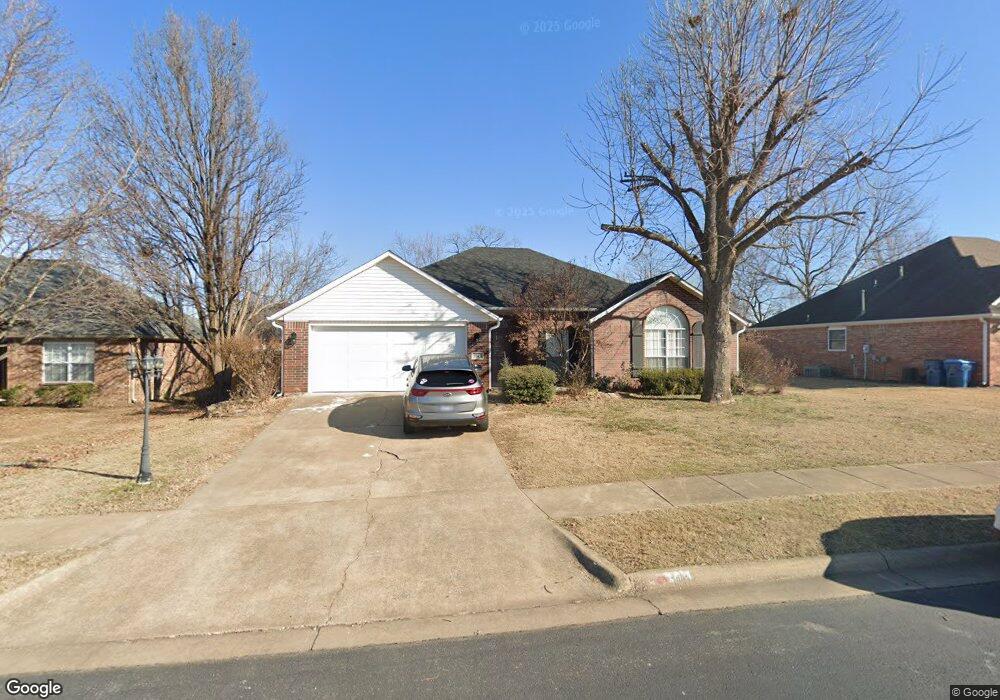
3903 SW Mason Rd Bentonville, AR 72712
Estimated Value: $357,000 - $435,000
4
Beds
2
Baths
1,941
Sq Ft
$207/Sq Ft
Est. Value
About This Home
This home is located at 3903 SW Mason Rd, Bentonville, AR 72712 and is currently estimated at $401,628, approximately $206 per square foot. 3903 SW Mason Rd is a home located in Benton County with nearby schools including Bright Field Middle School, Willowbrook Elementary School, and Fulbright Junior High School.
Ownership History
Date
Name
Owned For
Owner Type
Purchase Details
Closed on
Mar 13, 2025
Sold by
Young Robert M and Young Billie Jean
Bought by
Young Robert M and Young Billie Jean
Current Estimated Value
Home Financials for this Owner
Home Financials are based on the most recent Mortgage that was taken out on this home.
Original Mortgage
$416,456
Outstanding Balance
$414,333
Interest Rate
6.89%
Mortgage Type
VA
Estimated Equity
-$12,705
Purchase Details
Closed on
Jul 27, 2011
Sold by
Young Debra K
Bought by
Young Robert M
Purchase Details
Closed on
Mar 7, 2007
Sold by
Pozar Matthew John and Pozar Sue Ann
Bought by
Young Robert M and Young Debra K
Home Financials for this Owner
Home Financials are based on the most recent Mortgage that was taken out on this home.
Original Mortgage
$46,100
Interest Rate
6.26%
Mortgage Type
Stand Alone Second
Purchase Details
Closed on
Sep 18, 2001
Bought by
Pozar
Purchase Details
Closed on
Jan 30, 2001
Bought by
Walker Cons
Create a Home Valuation Report for This Property
The Home Valuation Report is an in-depth analysis detailing your home's value as well as a comparison with similar homes in the area
Home Values in the Area
Average Home Value in this Area
Purchase History
| Date | Buyer | Sale Price | Title Company |
|---|---|---|---|
| Young Robert M | $60,000 | None Listed On Document | |
| Young Robert M | -- | Elite Title Company Inc | |
| Young Robert M | $185,000 | None Available | |
| Pozar | $136,000 | -- | |
| Walker Cons | $22,000 | -- |
Source: Public Records
Mortgage History
| Date | Status | Borrower | Loan Amount |
|---|---|---|---|
| Open | Young Robert M | $416,456 | |
| Previous Owner | Young Robert M | $46,100 | |
| Previous Owner | Young Robert M | $138,300 |
Source: Public Records
Tax History Compared to Growth
Tax History
| Year | Tax Paid | Tax Assessment Tax Assessment Total Assessment is a certain percentage of the fair market value that is determined by local assessors to be the total taxable value of land and additions on the property. | Land | Improvement |
|---|---|---|---|---|
| 2025 | $2,472 | $63,434 | $15,600 | $47,834 |
| 2024 | $2,370 | $63,434 | $15,600 | $47,834 |
| 2023 | $2,257 | $42,930 | $8,000 | $34,930 |
| 2022 | $1,836 | $42,930 | $8,000 | $34,930 |
| 2021 | $1,728 | $42,930 | $8,000 | $34,930 |
| 2020 | $1,647 | $31,750 | $5,400 | $26,350 |
| 2019 | $1,647 | $31,750 | $5,400 | $26,350 |
| 2018 | $1,672 | $31,750 | $5,400 | $26,350 |
| 2017 | $1,609 | $31,750 | $5,400 | $26,350 |
| 2016 | $1,609 | $31,750 | $5,400 | $26,350 |
| 2015 | $1,882 | $30,450 | $9,500 | $20,950 |
| 2014 | $1,532 | $30,450 | $9,500 | $20,950 |
Source: Public Records
Map
Nearby Homes
- 4004 SW Banbury Dr
- 1813 SW Pine Ave
- 1602 SW Montrose Ave
- 1300 SW Willow Bend Ave
- 4605 SW Barton St
- 1812 SW Edinburgh Ave
- 4601 SW Hollowbrook St
- 2303 SW Chinquapin Ave
- 2402 SW Aster Way
- 1204 SW Edinburgh Ave
- 1104 SW Edinburgh Ave
- 4508 SW Birmingham St
- 4800 SW Blaire Mont Rd
- 2508 SW Nottingham Ave
- 4903 SW Newcastle Rd
- 4203 SW Lilac St
- 1202 SW Westbury Place
- 5000 SW Blaire Mont Rd
- 2603 SW Hampton Ave
- 5201 SW Newcastle Rd
- 3905 SW Mason Rd
- 4002 SW Staverton Dr
- 4004 SW Staverton Dr
- 4000 SW Staverton Dr
- 3907 SW Mason Rd
- 3904 SW Mason Rd
- 3906 SW Mason Rd
- 3902 SW Mason Rd
- 4006 SW Staverton Dr
- 3908 SW Mason Rd
- 3813 SW Mason Rd
- 3900 SW Mason Rd
- 4100 SW Staverton Dr
- 3908 SW Staverton Dr
- 3909 SW Mason Rd
- 3910 SW Mason Rd
- 3903 SW Maple Rd
- 3812 SW Mason Rd
- 3905 SW Maple Rd
- 4102 SW Staverton Dr