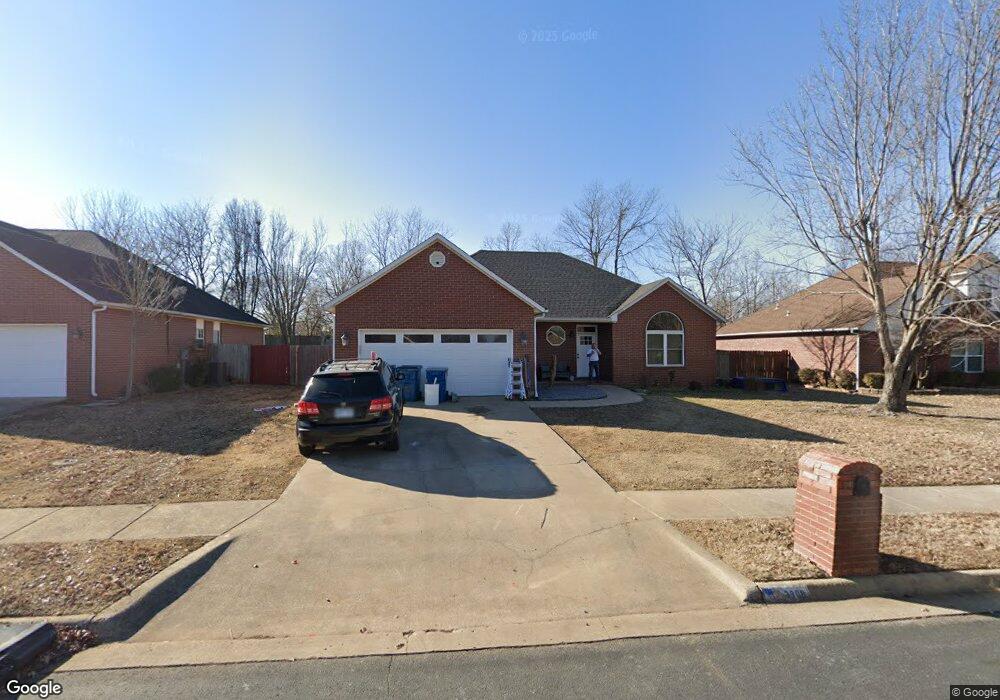
3908 SW Cherry Rd Bentonville, AR 72712
Estimated Value: $266,000 - $421,000
4
Beds
3
Baths
1,875
Sq Ft
$199/Sq Ft
Est. Value
About This Home
This home is located at 3908 SW Cherry Rd, Bentonville, AR 72712 and is currently estimated at $372,936, approximately $198 per square foot. 3908 SW Cherry Rd is a home located in Benton County with nearby schools including Bright Field Middle School, Willowbrook Elementary School, and Fulbright Junior High School.
Ownership History
Date
Name
Owned For
Owner Type
Purchase Details
Closed on
Sep 14, 2023
Sold by
Lucke Tanaya
Bought by
Kuykendall Joshua Allen and Kuykendall Tanita
Current Estimated Value
Home Financials for this Owner
Home Financials are based on the most recent Mortgage that was taken out on this home.
Original Mortgage
$160,000
Outstanding Balance
$156,568
Interest Rate
6.9%
Mortgage Type
New Conventional
Estimated Equity
$216,368
Purchase Details
Closed on
Nov 3, 2015
Sold by
Kavitha Siddada Suresh and Kavitha Siddada
Bought by
Lucke Michael A
Home Financials for this Owner
Home Financials are based on the most recent Mortgage that was taken out on this home.
Original Mortgage
$150,000
Interest Rate
3.8%
Purchase Details
Closed on
Nov 20, 2001
Bought by
Siddada
Purchase Details
Closed on
May 11, 2001
Bought by
Walker T
Create a Home Valuation Report for This Property
The Home Valuation Report is an in-depth analysis detailing your home's value as well as a comparison with similar homes in the area
Home Values in the Area
Average Home Value in this Area
Purchase History
| Date | Buyer | Sale Price | Title Company |
|---|---|---|---|
| Kuykendall Joshua Allen | $200,000 | None Listed On Document | |
| Lucke Michael A | $170,000 | First National Title Company | |
| Siddada | $127,000 | -- | |
| Walker T | $22,000 | -- |
Source: Public Records
Mortgage History
| Date | Status | Borrower | Loan Amount |
|---|---|---|---|
| Open | Kuykendall Joshua Allen | $160,000 | |
| Previous Owner | Lucke Michael A | $150,000 |
Source: Public Records
Tax History Compared to Growth
Tax History
| Year | Tax Paid | Tax Assessment Tax Assessment Total Assessment is a certain percentage of the fair market value that is determined by local assessors to be the total taxable value of land and additions on the property. | Land | Improvement |
|---|---|---|---|---|
| 2025 | $3,628 | $58,978 | $15,600 | $43,378 |
| 2024 | $3,645 | $58,978 | $15,600 | $43,378 |
| 2023 | $2,161 | $39,500 | $8,000 | $31,500 |
| 2022 | $1,654 | $39,500 | $8,000 | $31,500 |
| 2021 | $1,556 | $39,500 | $8,000 | $31,500 |
| 2020 | $1,481 | $29,140 | $5,400 | $23,740 |
| 2019 | $1,481 | $29,140 | $5,400 | $23,740 |
| 2018 | $1,506 | $29,140 | $5,400 | $23,740 |
| 2017 | $1,448 | $29,140 | $5,400 | $23,740 |
| 2016 | $1,448 | $29,140 | $5,400 | $23,740 |
| 2015 | $1,403 | $28,370 | $9,500 | $18,870 |
| 2014 | $1,753 | $28,370 | $9,500 | $18,870 |
Source: Public Records
Map
Nearby Homes
- 1813 SW Pine Ave
- 4004 SW Banbury Dr
- 1602 SW Montrose Ave
- 2303 SW Chinquapin Ave
- 2402 SW Aster Way
- 1812 SW Edinburgh Ave
- 4605 SW Barton St
- 1300 SW Willow Bend Ave
- 4508 SW Birmingham St
- 2508 SW Nottingham Ave
- 4601 SW Hollowbrook St
- 4203 SW Lilac St
- 1204 SW Edinburgh Ave
- 1104 SW Edinburgh Ave
- 2603 SW Hampton Ave
- 2904 SW Little Elm Loop
- 4800 SW Blaire Mont Rd
- 4903 SW Newcastle Rd
- 1202 SW Westbury Place
- 5000 SW Blaire Mont Rd
- 3906 SW Cherry Rd
- 3910 SW Cherry Rd
- Lot S Cherry Rd
- Lot N Cherry Rd
- 3904 SW Cherry Rd
- 3912 SW Cherry Rd
- 3909 SW Cherry Rd
- 3911 SW Cherry Rd
- 3907 SW Cherry Rd
- 3913 SW Cherry Rd
- 3914 SW Cherry Rd
- 3902 SW Cherry Rd
- 3905 SW Cherry Rd
- 3915 SW Cherry Rd
- 4000 SW Cherry Rd
- 3908 SW Maple Rd
- 3910 SW Maple Rd
- 3903 SW Cherry Rd
- 3906 SW Maple Rd
- 3912 SW Maple Rd