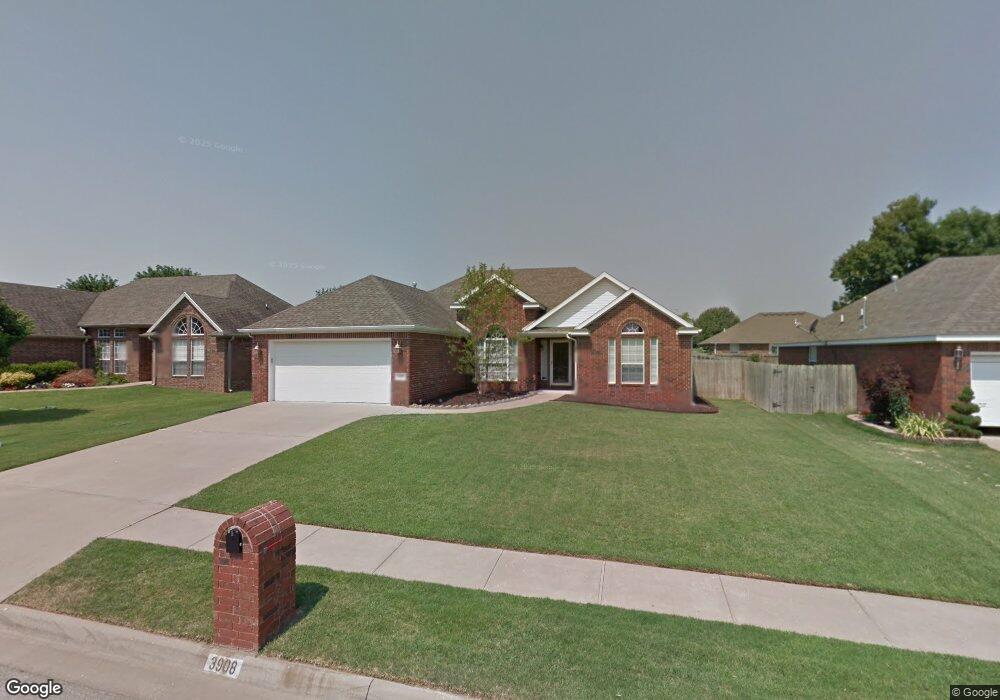
3908 SW Maple Rd Bentonville, AR 72712
Estimated Value: $375,900 - $419,000
--
Bed
2
Baths
1,836
Sq Ft
$216/Sq Ft
Est. Value
About This Home
This home is located at 3908 SW Maple Rd, Bentonville, AR 72712 and is currently estimated at $396,975, approximately $216 per square foot. 3908 SW Maple Rd is a home located in Benton County with nearby schools including Bright Field Middle School, Willowbrook Elementary School, and Fulbright Junior High School.
Ownership History
Date
Name
Owned For
Owner Type
Purchase Details
Closed on
Apr 21, 2015
Sold by
Gibbs Jefrey W and Gibbs Nancy E
Bought by
Gibbs Jeffrey W and Gibbs Nancy E
Current Estimated Value
Purchase Details
Closed on
Jul 29, 2013
Sold by
Gibbs Jeffrey W and Gibbs Nancy E
Bought by
Danda Gopi Kishore and Danda Kavitha
Home Financials for this Owner
Home Financials are based on the most recent Mortgage that was taken out on this home.
Original Mortgage
$135,000
Interest Rate
4.49%
Purchase Details
Closed on
Aug 5, 2005
Sold by
Gibbs Jeffrey W and Gibbs Nancy E
Bought by
Gibbs Jeffrey W and Gibbs Nancy E
Purchase Details
Closed on
Oct 12, 2001
Bought by
Gibbs
Purchase Details
Closed on
Apr 9, 2001
Bought by
Pinkley 6P
Purchase Details
Closed on
Jul 3, 2000
Bought by
Pinkley
Create a Home Valuation Report for This Property
The Home Valuation Report is an in-depth analysis detailing your home's value as well as a comparison with similar homes in the area
Home Values in the Area
Average Home Value in this Area
Purchase History
| Date | Buyer | Sale Price | Title Company |
|---|---|---|---|
| Gibbs Jeffrey W | -- | Attorney | |
| The Gibbs Family Trust | -- | Attorney | |
| Danda Gopi Kishore | $150,000 | Waco Title Company | |
| Gibbs Jeffrey W | -- | None Available | |
| Gibbs | $130,000 | -- | |
| Pinkley 6P | $129,000 | -- | |
| Pinkley | -- | -- |
Source: Public Records
Mortgage History
| Date | Status | Borrower | Loan Amount |
|---|---|---|---|
| Previous Owner | Danda Gopi Kishore | $135,000 |
Source: Public Records
Tax History Compared to Growth
Tax History
| Year | Tax Paid | Tax Assessment Tax Assessment Total Assessment is a certain percentage of the fair market value that is determined by local assessors to be the total taxable value of land and additions on the property. | Land | Improvement |
|---|---|---|---|---|
| 2025 | $2,729 | $59,764 | $15,600 | $44,164 |
| 2024 | $2,513 | $59,764 | $15,600 | $44,164 |
| 2023 | $2,284 | $40,060 | $8,000 | $32,060 |
| 2022 | $2,152 | $40,060 | $8,000 | $32,060 |
| 2021 | $1,583 | $40,060 | $8,000 | $32,060 |
| 2020 | $1,508 | $29,560 | $5,400 | $24,160 |
| 2019 | $1,508 | $29,560 | $5,400 | $24,160 |
| 2018 | $1,533 | $29,560 | $5,400 | $24,160 |
| 2017 | $1,474 | $29,560 | $5,400 | $24,160 |
| 2016 | $1,474 | $29,560 | $5,400 | $24,160 |
| 2015 | $1,774 | $28,710 | $9,500 | $19,210 |
| 2014 | $1,424 | $28,710 | $9,500 | $19,210 |
Source: Public Records
Map
Nearby Homes
- 4004 SW Banbury Dr
- 1813 SW Pine Ave
- 1602 SW Montrose Ave
- 1300 SW Willow Bend Ave
- 1812 SW Edinburgh Ave
- 4605 SW Barton St
- 2303 SW Chinquapin Ave
- 2402 SW Aster Way
- 4601 SW Hollowbrook St
- 1204 SW Edinburgh Ave
- 4508 SW Birmingham St
- 2508 SW Nottingham Ave
- 1104 SW Edinburgh Ave
- 4203 SW Lilac St
- 4800 SW Blaire Mont Rd
- 4903 SW Newcastle Rd
- 1202 SW Westbury Place
- 2603 SW Hampton Ave
- 5000 SW Blaire Mont Rd
- 2904 SW Little Elm Loop
- 3906 SW Maple Rd
- 3910 SW Maple Rd
- 3909 SW Cherry Rd
- 3907 SW Cherry Rd
- 3911 SW Cherry Rd
- 3904 SW Maple Rd
- 3912 SW Maple Rd
- 3900 SW Maple Rd
- 3909 SW Maple Rd
- 3907 SW Maple Rd
- 3911 SW Maple Rd
- 3905 SW Cherry Rd
- 3913 SW Cherry Rd
- Lot S Cherry Rd
- Lot N Cherry Rd
- 3902 SW Maple Rd
- 3905 SW Maple Rd
- 3913 SW Maple Rd
- 3914 SW Maple Rd
- 3903 SW Cherry Rd