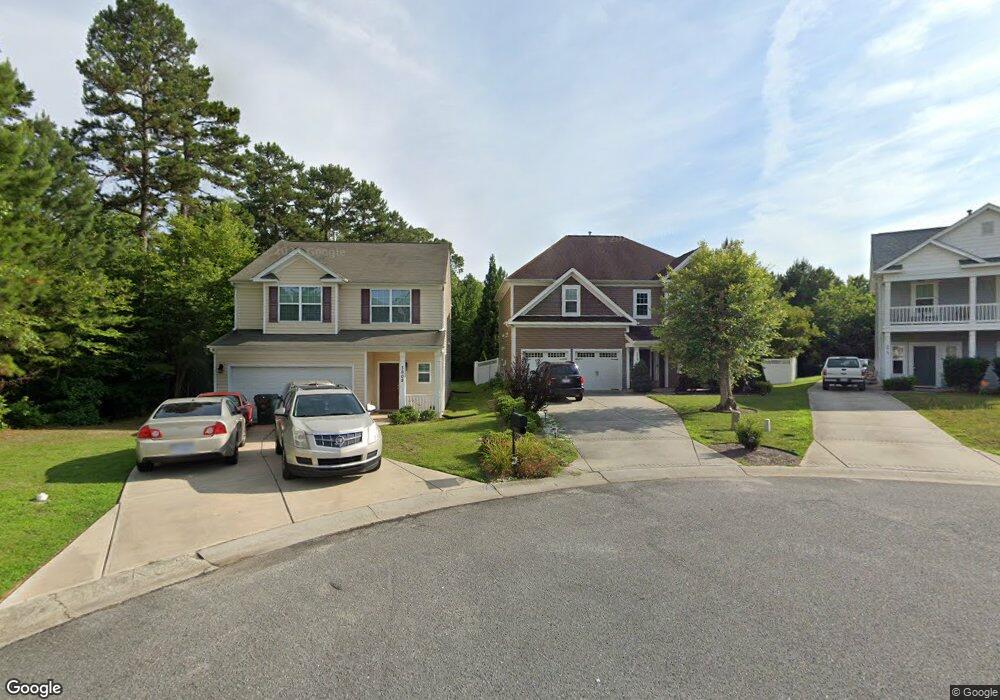
3909 Northerly Island Ct Gastonia, NC 28056
Estimated Value: $363,451 - $386,000
4
Beds
3
Baths
2,340
Sq Ft
$160/Sq Ft
Est. Value
About This Home
This home is located at 3909 Northerly Island Ct, Gastonia, NC 28056 and is currently estimated at $374,113, approximately $159 per square foot. 3909 Northerly Island Ct is a home located in Gaston County with nearby schools including Hershal H. Beam Elementary School, Southwest Middle School, and Forestview High School.
Ownership History
Date
Name
Owned For
Owner Type
Purchase Details
Closed on
May 26, 2016
Sold by
Bobis Eunice B
Bought by
Eunice B Bobis Linging Trust
Current Estimated Value
Purchase Details
Closed on
Feb 25, 2011
Sold by
Bittner Laura Edward
Bought by
Bittner Laura Edwards and Mack Cathy C Edwards
Home Financials for this Owner
Home Financials are based on the most recent Mortgage that was taken out on this home.
Original Mortgage
$172,800
Outstanding Balance
$112,752
Interest Rate
3.75%
Mortgage Type
New Conventional
Estimated Equity
$261,361
Purchase Details
Closed on
Dec 21, 2007
Sold by
Parkside Partners Inc
Bought by
Bittner Laura Edwards
Home Financials for this Owner
Home Financials are based on the most recent Mortgage that was taken out on this home.
Original Mortgage
$209,953
Interest Rate
6.15%
Mortgage Type
Purchase Money Mortgage
Create a Home Valuation Report for This Property
The Home Valuation Report is an in-depth analysis detailing your home's value as well as a comparison with similar homes in the area
Home Values in the Area
Average Home Value in this Area
Purchase History
| Date | Buyer | Sale Price | Title Company |
|---|---|---|---|
| Eunice B Bobis Linging Trust | -- | None Available | |
| Bittner Laura Edwards | -- | None Available | |
| Bittner Laura Edwards | $233,500 | None Available |
Source: Public Records
Mortgage History
| Date | Status | Borrower | Loan Amount |
|---|---|---|---|
| Open | Bittner Laura Edwards | $172,800 | |
| Closed | Bittner Laura Edwards | $209,953 |
Source: Public Records
Tax History Compared to Growth
Tax History
| Year | Tax Paid | Tax Assessment Tax Assessment Total Assessment is a certain percentage of the fair market value that is determined by local assessors to be the total taxable value of land and additions on the property. | Land | Improvement |
|---|---|---|---|---|
| 2025 | $3,529 | $330,160 | $35,000 | $295,160 |
| 2024 | $3,529 | $330,160 | $35,000 | $295,160 |
| 2023 | $3,566 | $330,160 | $35,000 | $295,160 |
| 2022 | $2,733 | $205,470 | $28,000 | $177,470 |
| 2021 | $2,774 | $205,470 | $28,000 | $177,470 |
| 2019 | $2,794 | $205,470 | $28,000 | $177,470 |
| 2018 | $2,468 | $176,258 | $20,800 | $155,458 |
| 2017 | $2,468 | $176,258 | $20,800 | $155,458 |
| 2016 | $2,468 | $176,258 | $0 | $0 |
| 2014 | $2,654 | $189,603 | $26,000 | $163,603 |
Source: Public Records
Map
Nearby Homes
- 4003 Northerly Island Ct
- 3932 Schenley Ave
- 3843 Schenley Ave
- Plan 1522 at Village at Parkside
- Plan 2709 at Village at Parkside
- Plan 1634 at Village at Parkside
- Plan 2628 at Village at Parkside
- Plan 2121 at Village at Parkside
- Plan 2131 at Village at Parkside
- Plan 3105 at Village at Parkside
- Plan 2408 at Village at Parkside
- Plan 2307 at Village at Parkside
- Plan 1643 at Village at Parkside
- 717 Inwood Hill Dr Unit 95
- 705 Centennial St
- 713 Inwood Hill Dr Unit 96
- 704 Robert Moses Dr Unit 121
- 3934 Port Richmond Ave Unit 98
- 3925 Port Richmond Ave
- 3942 Port Richmond Ave Unit 13
- 3913 Northerly Island Ct
- 3905 Northerly Island Ct
- 3917 Northerly Island Ct Unit LOT223
- 3921 Northerly Island Ct
- 3925 Northerly Island Ct Unit 225
- 3925 Northerly Island Ct
- 3922 Northerly Island Ct Unit LOT218
- 3922 Northerly Island Ct
- 3929 Northerly Island Ct Unit 226
- 3929 Northerly Island Ct
- 3926 Northerly Island Ct Unit 217
- 3926 Northerly Island Ct
- 3933 Northerly Island Ct Unit 226
- 3933 Northerly Island Ct Unit LOT227
- 3930 Northerly Island Ct Unit 216
- 3930 Northerly Island Ct
- 3908 Schenley Ave
- 3904 Schenley Ave
- 3912 Schenley Ave
- 3912 Schenley Ave Unit 80