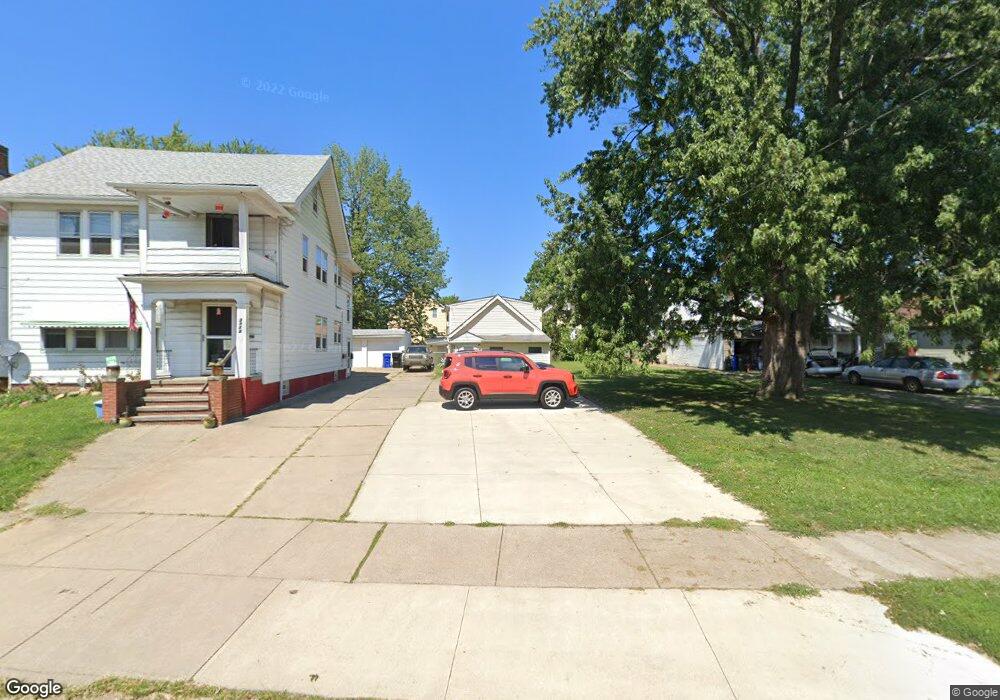
3914 Stickney Ave Cleveland, OH 44109
Old Brooklyn NeighborhoodEstimated Value: $93,000 - $147,000
2
Beds
1
Bath
762
Sq Ft
$146/Sq Ft
Est. Value
About This Home
This home is located at 3914 Stickney Ave, Cleveland, OH 44109 and is currently estimated at $111,282, approximately $146 per square foot. 3914 Stickney Ave is a home located in Cuyahoga County with nearby schools including Benjamin Franklin, Almira Academy, and Artemus Ward School.
Ownership History
Date
Name
Owned For
Owner Type
Purchase Details
Closed on
Oct 14, 2009
Sold by
Werchelowksy Andrew J and Nawaleniec Michael
Bought by
Cox Gary
Current Estimated Value
Purchase Details
Closed on
Jun 18, 2008
Sold by
Beningo Frank A and Beningo Rachelle
Bought by
Kohutick Michael
Purchase Details
Closed on
Jun 17, 2008
Sold by
Kohutick Michael and Kohutick Michael
Bought by
Werchelowsky Andrew J and Nawaleniec Michael
Purchase Details
Closed on
Jul 25, 2007
Sold by
Kohutich Michael
Bought by
Beningo Frank A
Home Financials for this Owner
Home Financials are based on the most recent Mortgage that was taken out on this home.
Original Mortgage
$98,000
Interest Rate
6.76%
Mortgage Type
Seller Take Back
Purchase Details
Closed on
Mar 20, 1985
Sold by
Kohutich Michael
Bought by
Kohutich Michael
Purchase Details
Closed on
Feb 17, 1983
Sold by
Radio John
Bought by
Kohutich Michael
Purchase Details
Closed on
Jan 1, 1975
Bought by
Radio John
Create a Home Valuation Report for This Property
The Home Valuation Report is an in-depth analysis detailing your home's value as well as a comparison with similar homes in the area
Home Values in the Area
Average Home Value in this Area
Purchase History
| Date | Buyer | Sale Price | Title Company |
|---|---|---|---|
| Cox Gary | $9,000 | Attorney | |
| Kohutick Michael | -- | Land Title Agency | |
| Werchelowsky Andrew J | $7,000 | Attorney | |
| Beningo Frank A | $110,000 | Attorney | |
| Kohutich Michael | -- | -- | |
| Kohutich Michael | -- | -- | |
| Radio John | -- | -- |
Source: Public Records
Mortgage History
| Date | Status | Borrower | Loan Amount |
|---|---|---|---|
| Previous Owner | Beningo Frank A | $98,000 |
Source: Public Records
Tax History Compared to Growth
Tax History
| Year | Tax Paid | Tax Assessment Tax Assessment Total Assessment is a certain percentage of the fair market value that is determined by local assessors to be the total taxable value of land and additions on the property. | Land | Improvement |
|---|---|---|---|---|
| 2024 | $1,358 | $20,300 | $8,645 | $11,655 |
| 2023 | $1,896 | $16,800 | $5,740 | $11,060 |
| 2022 | $1,295 | $16,800 | $5,740 | $11,060 |
| 2021 | $1,283 | $16,800 | $5,740 | $11,060 |
| 2020 | $1,151 | $13,020 | $4,450 | $8,580 |
| 2019 | $1,066 | $37,200 | $12,700 | $24,500 |
| 2018 | $954 | $13,020 | $4,450 | $8,580 |
| 2017 | $852 | $10,080 | $3,710 | $6,370 |
| 2016 | $846 | $10,080 | $3,710 | $6,370 |
| 2015 | $867 | $10,080 | $3,710 | $6,370 |
| 2014 | $867 | $10,290 | $3,780 | $6,510 |
Source: Public Records
Map
Nearby Homes
- 4611 W 41st St
- 3911 Biddulph Ave
- 3912 Oak Park Ave
- 4315 Stickney Ave
- 4581 Pearl Rd
- 3801 Archmere Ave
- 3820 Bader Ave
- 3909 Behrwald Ave
- 4512 Oak Park Ave
- 3908 Behrwald Ave
- 4506 Bader Ave
- 4405 Bader Ave
- 3301 Hillcrest Ave
- 3801 Burger Ave
- 3404 Cypress Ave
- 3616 Cecilia Ave
- 3910 Wetzel Ave
- 3704 Dawning Ave
- 4520 Wichita Ave
- 3513 Dawning Ave
- 3918 Stickney Ave
- 3908 Stickney Ave
- 4000 Stickney Ave
- 3906 Stickney Ave
- 4006 Stickney Ave
- 3904 Stickney Ave
- 3913 Biddulph Ave
- 4001 Biddulph Ave
- 4005 Biddulph Ave
- 3818 Stickney Ave
- 3907 Biddulph Ave
- 4012 Stickney Ave
- 3913 Stickney Ave
- 3917 Stickney Ave
- 4591 W 41st St
- 4009 Biddulph Ave
- 3909 Stickney Ave
- 3919 Stickney Ave
- 4613 W 41st St
- 3814 Stickney Ave