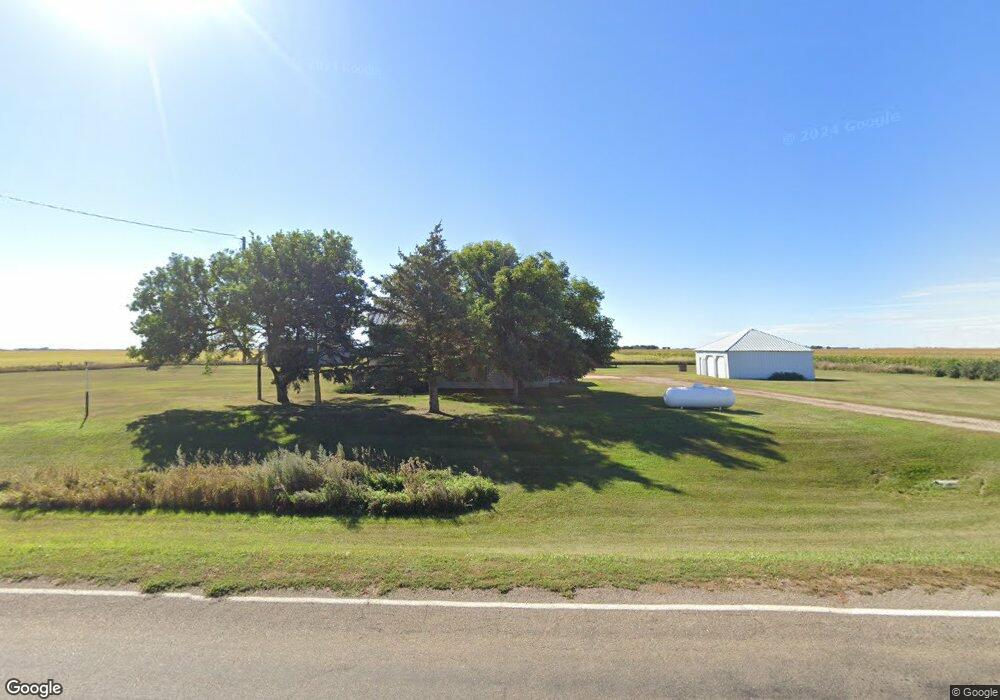
39151 183rd St Hitchcock, SD 57348
Estimated Value: $430,000 - $463,297
4
Beds
1
Bath
2,268
Sq Ft
$197/Sq Ft
Est. Value
About This Home
This home is located at 39151 183rd St, Hitchcock, SD 57348 and is currently estimated at $446,649, approximately $196 per square foot. 39151 183rd St is a home located in Spink County with nearby schools including Hitchcock-Tulare Elementary School, Spink Colony Elementary School, and Hitchcock-Tulare High School.
Create a Home Valuation Report for This Property
The Home Valuation Report is an in-depth analysis detailing your home's value as well as a comparison with similar homes in the area
Home Values in the Area
Average Home Value in this Area
Tax History Compared to Growth
Tax History
| Year | Tax Paid | Tax Assessment Tax Assessment Total Assessment is a certain percentage of the fair market value that is determined by local assessors to be the total taxable value of land and additions on the property. | Land | Improvement |
|---|---|---|---|---|
| 2025 | $2,196 | $426,360 | $369,091 | $57,269 |
| 2024 | $2,082 | $388,028 | $330,759 | $57,269 |
| 2023 | $2,000 | $372,322 | $315,053 | $57,269 |
| 2022 | $1,989 | $374,854 | $327,524 | $47,330 |
| 2021 | $2,034 | $374,707 | $327,377 | $47,330 |
| 2020 | $2,080 | $392,094 | $344,764 | $47,330 |
| 2019 | $2,021 | $394,368 | $349,288 | $45,080 |
| 2018 | $1,965 | $387,697 | $349,267 | $38,430 |
| 2017 | $1,952 | $376,903 | $344,883 | $32,020 |
| 2016 | $1,906 | $370,812 | $341,547 | $29,265 |
| 2015 | -- | $326,627 | $297,362 | $29,265 |
| 2014 | -- | $326,627 | $297,362 | $29,265 |
| 2013 | -- | $276,090 | $248,219 | $27,871 |
Source: Public Records
Map
Nearby Homes
- 206 Dakota St
- 17462 U S 281
- 3021 Meadow Dr
- 1426 E 2nd St
- 1202 E 1st St
- 825 E 7th Ave
- 1117 W 3rd St
- 605 E 6th Ave
- 426 E 6th Ave
- 511 E 6th Ave
- 410 E 6th Ave
- 313 E 2nd St
- 818 W 5th St
- 506 W 1st St
- 209 W 7th St
- 38286 10th Ave W
- 1021 Sd Highway 26 Unit LotWP001
- 1021 Sd Highway 26
- 40331 N Shore Rd
- 0 Lot9 North Shore Rd Lake Byron