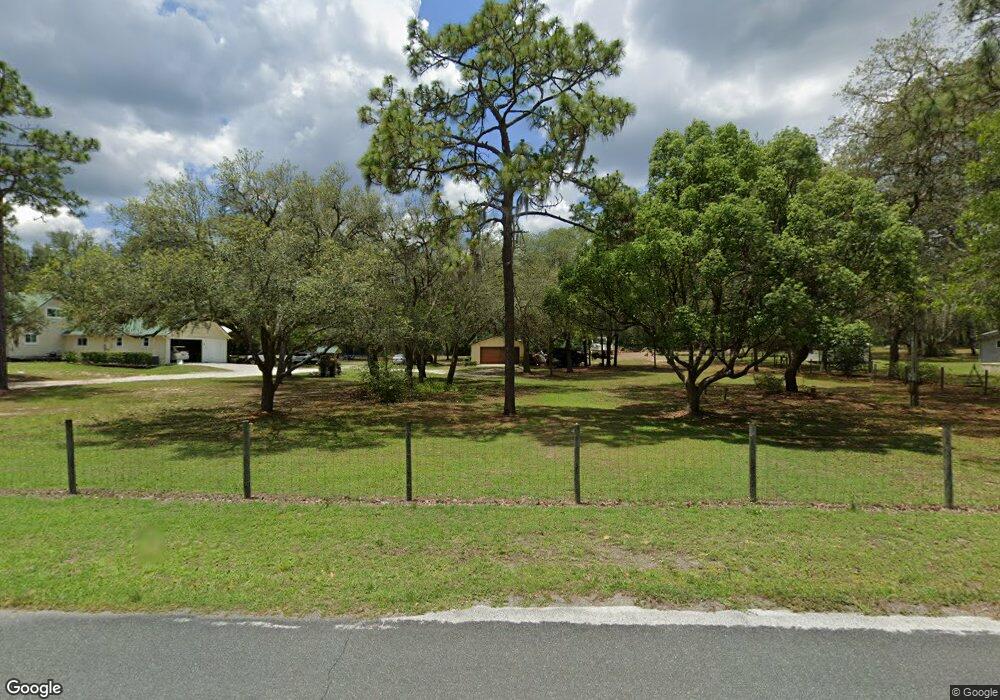
3916 N Calumet Terrace Hernando, FL 34442
Estimated Value: $307,000 - $506,000
2
Beds
2
Baths
1,208
Sq Ft
$340/Sq Ft
Est. Value
About This Home
This home is located at 3916 N Calumet Terrace, Hernando, FL 34442 and is currently estimated at $410,501, approximately $339 per square foot. 3916 N Calumet Terrace is a home located in Citrus County with nearby schools including Central Ridge Elementary School, Citrus Springs Middle School, and Lecanto High School.
Ownership History
Date
Name
Owned For
Owner Type
Purchase Details
Closed on
Sep 23, 2016
Sold by
Owens Dallas R and Owens Aimee
Bought by
Baker Joshua Wesley and Baker Lydia Celine
Current Estimated Value
Home Financials for this Owner
Home Financials are based on the most recent Mortgage that was taken out on this home.
Original Mortgage
$137,200
Outstanding Balance
$108,994
Interest Rate
3.43%
Mortgage Type
New Conventional
Estimated Equity
$301,507
Purchase Details
Closed on
Aug 1, 2011
Bought by
Baker Joshua Wesley and Baker Lydia Celine
Purchase Details
Closed on
Apr 1, 2011
Bought by
Baker Joshua Wesley and Baker Lydia Celine
Purchase Details
Closed on
Mar 23, 2011
Sold by
Teets Louis P and Teets Carole A
Bought by
Teets Carole A
Purchase Details
Closed on
Mar 1, 2011
Bought by
Baker Joshua Wesley and Baker Lydia Celine
Create a Home Valuation Report for This Property
The Home Valuation Report is an in-depth analysis detailing your home's value as well as a comparison with similar homes in the area
Home Values in the Area
Average Home Value in this Area
Purchase History
| Date | Buyer | Sale Price | Title Company |
|---|---|---|---|
| Baker Joshua Wesley | $171,500 | Fidelity Title Services Llc | |
| Baker Joshua Wesley | $144,000 | -- | |
| Baker Joshua Wesley | $100 | -- | |
| Teets Carole A | -- | Attorney | |
| Baker Joshua Wesley | $100 | -- |
Source: Public Records
Mortgage History
| Date | Status | Borrower | Loan Amount |
|---|---|---|---|
| Open | Baker Joshua Wesley | $137,200 |
Source: Public Records
Tax History Compared to Growth
Tax History
| Year | Tax Paid | Tax Assessment Tax Assessment Total Assessment is a certain percentage of the fair market value that is determined by local assessors to be the total taxable value of land and additions on the property. | Land | Improvement |
|---|---|---|---|---|
| 2025 | $1,468 | $132,580 | -- | -- |
| 2024 | $1,425 | $128,844 | -- | -- |
| 2023 | $1,425 | $125,091 | $0 | $0 |
| 2022 | $1,310 | $119,846 | $0 | $0 |
| 2021 | $1,257 | $116,355 | $0 | $0 |
| 2020 | $1,190 | $165,191 | $27,960 | $137,231 |
| 2019 | $1,170 | $149,403 | $24,420 | $124,983 |
| 2018 | $1,140 | $144,885 | $24,460 | $120,425 |
| 2017 | $1,131 | $107,571 | $21,580 | $85,991 |
| 2016 | $871 | $88,614 | $23,020 | $65,594 |
| 2015 | $879 | $87,998 | $23,140 | $64,858 |
| 2014 | $892 | $87,300 | $19,853 | $67,447 |
Source: Public Records
Map
Nearby Homes
- 4165 N Indianriver Dr
- 4140 and 4150 N Elwyn Point
- 1414 E Tradewind Dr
- 4213 N Baywood Dr
- 4396 N Forest Lake Dr
- 1399 E Ridgefield Dr
- 1540 E Wedgewood Ln
- 4130 N Indianhead Rd
- 1350 E Ridgefield Dr
- 3401 N Bonnie Point
- 4250 N Indianhead Rd
- 3922 N Longvalley Rd
- 1691 E Sheridan Ln
- 1264 E Getty Ln
- 1300 E Ridgefield Dr
- 2533 E Chivalry Ct
- 2040 N Florida Ave
- 3542 N Chandler Dr
- 2546 E Chivalry Ct
- 3501 N Chandler Dr
- 3880 N Calumet Terrace
- 3943 N Calumet Terrace
- 3911 N Indianriver Dr
- 3933 N Indianriver Dr
- 3889 N Indianriver Dr
- 3905 N Calumet Terrace
- 3889 N Indian River Dr
- 3965 N Indianriver Dr
- 3872 N Baywood Dr
- 1908 E Maryann Ln
- 1908 E Mary Ann Ln
- 3854 N Baywood Dr
- 0 E Westgate Ln
- 1737 E Westgate Ln
- 3817 N Indianriver Dr
- 1813 E Westgate Ln
- 3814 N Calumet Terrace
- 3845 N Calumet Terrace
- 3984 N Elwyn Point
- 3795 N Indianriver Dr