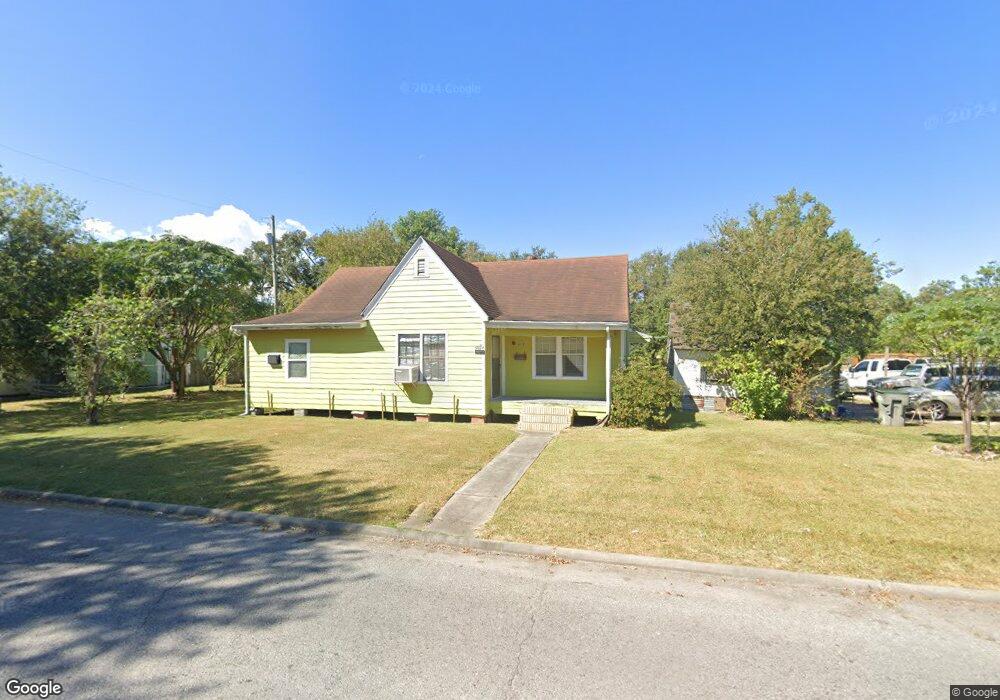
3917 7th St Port Arthur, TX 77642
Estimated Value: $63,000 - $90,000
--
Bed
--
Bath
1,372
Sq Ft
$57/Sq Ft
Est. Value
About This Home
This home is located at 3917 7th St, Port Arthur, TX 77642 and is currently estimated at $78,499, approximately $57 per square foot. 3917 7th St is a home located in Jefferson County with nearby schools including Lakeview Elementary School, Jefferson Middle School, and Memorial High School.
Ownership History
Date
Name
Owned For
Owner Type
Purchase Details
Closed on
Nov 25, 2024
Sold by
Oliveros Jose A and Ceja Oralia
Bought by
Oliveros Ramiro and Oliveros Rosalinda
Current Estimated Value
Purchase Details
Closed on
Oct 3, 2024
Sold by
Lopez Ramiro Oliveros
Bought by
Contreras Jose Antonio Oliv and Ceja Oralia
Purchase Details
Closed on
Aug 14, 2009
Sold by
Robles David
Bought by
Oliveros Lopez Ramiro
Purchase Details
Closed on
May 18, 2004
Sold by
Pham Lieng Thi
Bought by
Robles David
Create a Home Valuation Report for This Property
The Home Valuation Report is an in-depth analysis detailing your home's value as well as a comparison with similar homes in the area
Home Values in the Area
Average Home Value in this Area
Purchase History
| Date | Buyer | Sale Price | Title Company |
|---|---|---|---|
| Oliveros Ramiro | -- | None Listed On Document | |
| Contreras Jose Antonio Oliv | -- | None Listed On Document | |
| Oliveros Lopez Ramiro | -- | None Available | |
| Robles David | -- | -- |
Source: Public Records
Tax History Compared to Growth
Tax History
| Year | Tax Paid | Tax Assessment Tax Assessment Total Assessment is a certain percentage of the fair market value that is determined by local assessors to be the total taxable value of land and additions on the property. | Land | Improvement |
|---|---|---|---|---|
| 2025 | $511 | $70,083 | $8,100 | $61,983 |
| 2024 | $511 | $41,311 | -- | -- |
| 2023 | $511 | $37,555 | $0 | $0 |
| 2022 | $1,084 | $34,141 | $0 | $0 |
| 2021 | $1,029 | $76,386 | $3,492 | $72,894 |
| 2020 | $441 | $28,215 | $3,492 | $24,723 |
| 2019 | $839 | $26,310 | $3,490 | $22,820 |
| 2018 | $375 | $26,310 | $3,490 | $22,820 |
| 2017 | $279 | $22,270 | $3,490 | $18,780 |
| 2016 | $652 | $22,270 | $3,490 | $18,780 |
| 2015 | $472 | $22,270 | $3,490 | $18,780 |
| 2014 | $472 | $25,400 | $3,490 | $21,910 |
Source: Public Records
Map
Nearby Homes