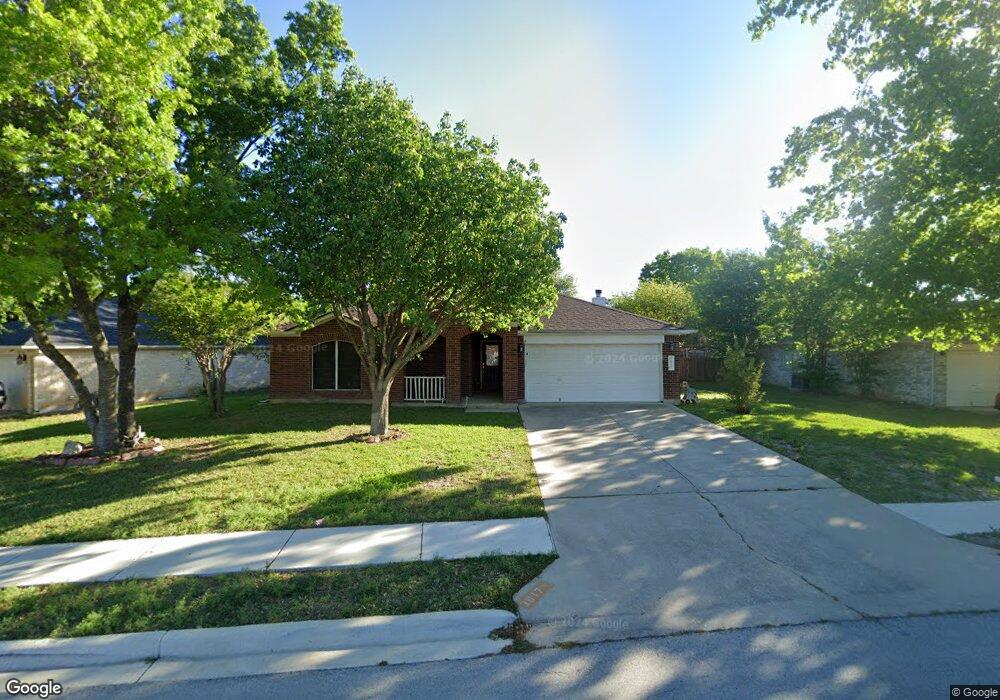
3917 Orion St Round Rock, TX 78665
Stony Point NeighborhoodEstimated Value: $326,000 - $352,000
--
Bed
2
Baths
1,762
Sq Ft
$193/Sq Ft
Est. Value
About This Home
This home is located at 3917 Orion St, Round Rock, TX 78665 and is currently estimated at $340,721, approximately $193 per square foot. 3917 Orion St is a home located in Williamson County with nearby schools including Caldwell Heights Elementary IB World School, Hopewell Middle School, and Stony Point High IB World School.
Ownership History
Date
Name
Owned For
Owner Type
Purchase Details
Closed on
Mar 27, 2014
Sold by
101 Partnership Ltd
Bought by
Cmh Homes Inc
Current Estimated Value
Purchase Details
Closed on
Dec 3, 2013
Sold by
Givens James W and Givens Elizabeth M
Bought by
101 Partnership Ltd
Purchase Details
Closed on
Apr 15, 2013
Sold by
101 Partnership Ltd
Bought by
Givens James W and Givens Elizabeth M
Home Financials for this Owner
Home Financials are based on the most recent Mortgage that was taken out on this home.
Original Mortgage
$69,000
Interest Rate
3.67%
Mortgage Type
Seller Take Back
Purchase Details
Closed on
May 5, 2005
Sold by
Neill Jackie Lloyd
Bought by
Neill Betty Hinkle
Purchase Details
Closed on
Oct 8, 2002
Sold by
Neill Virginia
Bought by
Neill Jackie Lloyd
Create a Home Valuation Report for This Property
The Home Valuation Report is an in-depth analysis detailing your home's value as well as a comparison with similar homes in the area
Home Values in the Area
Average Home Value in this Area
Purchase History
| Date | Buyer | Sale Price | Title Company |
|---|---|---|---|
| Cmh Homes Inc | -- | Independence Title Company | |
| 101 Partnership Ltd | $71,021 | None Available | |
| Givens James W | -- | None Available | |
| Neill Betty Hinkle | -- | None Available | |
| Neill Jackie Lloyd | -- | None Available |
Source: Public Records
Mortgage History
| Date | Status | Borrower | Loan Amount |
|---|---|---|---|
| Previous Owner | Givens James W | $69,000 |
Source: Public Records
Tax History Compared to Growth
Tax History
| Year | Tax Paid | Tax Assessment Tax Assessment Total Assessment is a certain percentage of the fair market value that is determined by local assessors to be the total taxable value of land and additions on the property. | Land | Improvement |
|---|---|---|---|---|
| 2025 | $1,915 | $349,502 | $75,900 | $273,602 |
| 2024 | $1,915 | $331,895 | -- | -- |
| 2023 | $1,701 | $301,723 | $0 | $0 |
| 2022 | $5,202 | $274,294 | $0 | $0 |
| 2021 | $5,597 | $249,358 | $60,000 | $217,078 |
| 2020 | $5,117 | $226,689 | $57,084 | $169,605 |
| 2019 | $5,379 | $233,014 | $52,200 | $180,814 |
| 2018 | $2,952 | $213,042 | $45,903 | $167,139 |
| 2017 | $4,932 | $209,365 | $42,900 | $173,135 |
| 2016 | $4,484 | $190,332 | $42,900 | $149,501 |
| 2015 | $2,816 | $173,029 | $35,800 | $137,229 |
| 2014 | $2,816 | $157,926 | $0 | $0 |
Source: Public Records
Map
Nearby Homes
- 1310 Quicksilver St
- 1420 Quicksilver Cir
- 3807 Haleys Way
- 1307 Terra St
- 1319 Ashley Dr
- 3808 Julianas Way
- 1532 Lorson Loop
- 915 Satellite View
- 3710 Haleys Way
- 1564 Lorson Loop
- 3725 Birdhouse Dr
- 3651 Sandy Brook Dr Unit 202
- 3651 Sandy Brook Dr Unit 229
- 802 Meadow Bluff Ct
- 1110 Water Birch
- 3618 Eagles Nest St
- 3612 Short Horn Ln
- 1103 Terra St
- 702 Bent Wood Place
- 3723 Cheyenne St
- 3919 Orion St
- 3915 Orion St
- 1401 Quicksilver Cir
- 3921 Orion St
- 3913 Orion St
- 1403 Quicksilver Cir
- 3916 Orion St
- 3918 Orion St
- 3920 Orion St
- 3923 Orion St
- 3914 Orion St
- 1402 Quicksilver Cir
- 3922 Orion St
- 1405 Quicksilver Cir
- 3911 Orion St
- 3912 Orion St
- 1404 Quicksilver Cir
- 1407 Quicksilver Cir
- 801 Satellite View
- 805 Satellite View Unit 807