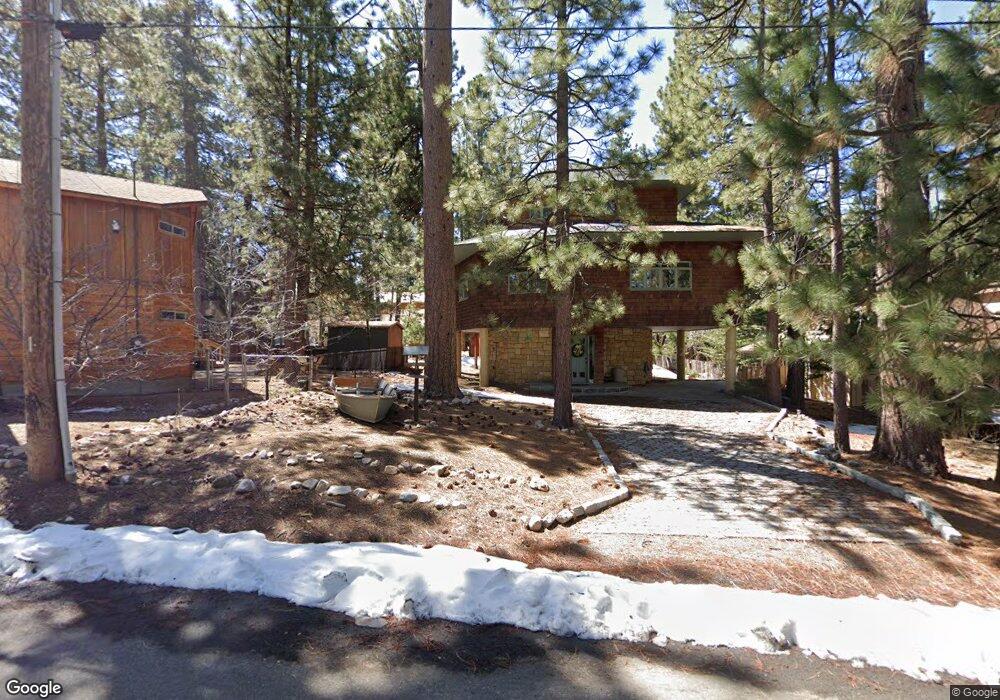
39189 Buckthorn Rd Big Bear Lake, CA 92315
Estimated Value: $627,000 - $718,000
3
Beds
2
Baths
1,756
Sq Ft
$376/Sq Ft
Est. Value
About This Home
This home is located at 39189 Buckthorn Rd, Big Bear Lake, CA 92315 and is currently estimated at $660,165, approximately $375 per square foot. 39189 Buckthorn Rd is a home with nearby schools including Big Bear Middle School and Big Bear High School.
Ownership History
Date
Name
Owned For
Owner Type
Purchase Details
Closed on
Nov 29, 2010
Sold by
Dale Denver T and Dale Afsaneh
Bought by
Dale Denver T and Dale Afsaneh
Current Estimated Value
Home Financials for this Owner
Home Financials are based on the most recent Mortgage that was taken out on this home.
Original Mortgage
$176,400
Outstanding Balance
$117,313
Interest Rate
4.35%
Mortgage Type
New Conventional
Estimated Equity
$542,852
Purchase Details
Closed on
Jul 28, 2005
Sold by
Dale Denver and Dale Afsaneh
Bought by
Dale Denver T and Dale Afsaneh
Purchase Details
Closed on
Jun 15, 1995
Sold by
Lenahan Thomas M and Lenahan Cheryl L
Bought by
Dale Denver and Dale Afsaneh
Home Financials for this Owner
Home Financials are based on the most recent Mortgage that was taken out on this home.
Original Mortgage
$31,500
Interest Rate
7.71%
Mortgage Type
Seller Take Back
Create a Home Valuation Report for This Property
The Home Valuation Report is an in-depth analysis detailing your home's value as well as a comparison with similar homes in the area
Home Values in the Area
Average Home Value in this Area
Purchase History
| Date | Buyer | Sale Price | Title Company |
|---|---|---|---|
| Dale Denver T | -- | Accommodation | |
| Dale Denver T | -- | First Title | |
| Dale Denver T | -- | -- | |
| Dale Denver | $45,000 | Commonwealth Land Title Co |
Source: Public Records
Mortgage History
| Date | Status | Borrower | Loan Amount |
|---|---|---|---|
| Open | Dale Denver T | $176,400 | |
| Previous Owner | Dale Denver | $31,500 |
Source: Public Records
Tax History Compared to Growth
Tax History
| Year | Tax Paid | Tax Assessment Tax Assessment Total Assessment is a certain percentage of the fair market value that is determined by local assessors to be the total taxable value of land and additions on the property. | Land | Improvement |
|---|---|---|---|---|
| 2025 | $5,389 | $401,611 | $74,758 | $326,853 |
| 2024 | $5,389 | $393,736 | $73,292 | $320,444 |
| 2023 | $5,222 | $386,016 | $71,855 | $314,161 |
| 2022 | $5,008 | $378,447 | $70,446 | $308,001 |
| 2021 | $4,564 | $342,025 | $69,063 | $272,962 |
| 2020 | $4,619 | $338,518 | $68,355 | $270,163 |
| 2019 | $4,508 | $331,881 | $67,015 | $264,866 |
| 2018 | $4,359 | $325,374 | $65,701 | $259,673 |
| 2017 | $4,249 | $318,994 | $64,413 | $254,581 |
| 2016 | $4,157 | $312,739 | $63,150 | $249,589 |
| 2015 | $4,123 | $308,041 | $62,201 | $245,840 |
| 2014 | $4,051 | $302,007 | $60,983 | $241,024 |
Source: Public Records
Map
Nearby Homes
- 368 Pulaski Rd
- 368 Pulaski Rd
- 547 Chipmunk Ln
- 39124 Waterview Dr
- 39196 Starview Ln
- 39080 Waterview Dr
- 39276 Waterview Dr
- 535 Cienega Rd
- 612 Timber Ln
- 572 Cienega Rd
- 543 Chipmunk Ln
- 39309 Peak Ln
- 39243 Crest Ln
- 39246 Willow Landing Rd
- 39050 Willow Landing
- 39298 Willow Landing Rd
- 0 Cienega Unit PW20178991
- 39104 Willow Landing Rd
- 657 Cienega Rd
- 760 Blue Jay Rd Unit 10
- 510 Timber Ln
- 39179 Buckthorn Rd
- 522 Timber Ln
- 0 Buckthorn Rd Unit 32301274
- 0 Buckthorn Rd Unit 219033497
- 0 Buckthorn Rd
- 39192 Buckthorn Rd
- 39198 Robin Rd
- 39161 Buckthorn Rd
- 39178 Robin Rd
- 39184 Buckthorn Rd
- 39188 Robin Rd
- 486 Timber Ln
- 39208 Robin Rd
- 39160 Robin Rd
- 39170 Buckthorn Rd
- 509 Timber Ln
- 497 Timber Ln
- 523 Timber Ln
- 487 Timber Ln