Estimated Value: $399,000 - $596,000
3
Beds
2
Baths
2,182
Sq Ft
$239/Sq Ft
Est. Value
About This Home
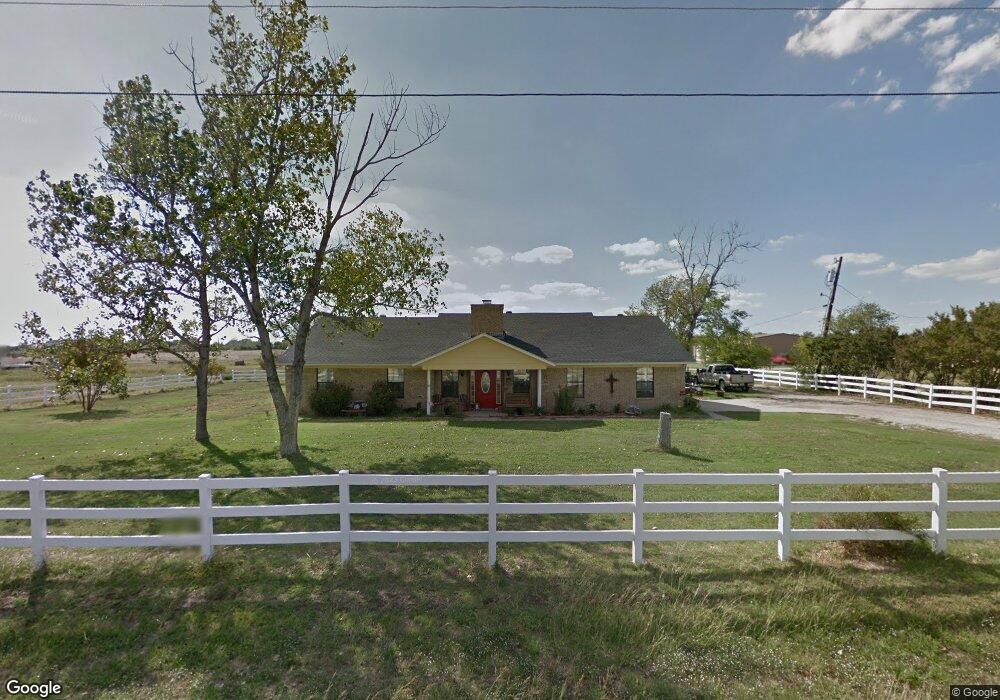
This home is located at 3939 Hopkins Rd, Krum, TX 76249 and is currently estimated at $522,588, approximately $239 per square foot. 3939 Hopkins Rd is a home located in Denton County with nearby schools including Krum Early Education Center, Blanche Dodd Intermediate School, and Krum Middle School.
Ownership History
Date
Name
Owned For
Owner Type
Purchase Details
Closed on
Oct 9, 2020
Sold by
Angeles Saul and Angeles Margarita
Bought by
Gonzalez Jose and Gonzalez Reina
Current Estimated Value
Home Financials for this Owner
Home Financials are based on the most recent Mortgage that was taken out on this home.
Original Mortgage
$274,725
Outstanding Balance
$244,353
Interest Rate
2.9%
Mortgage Type
New Conventional
Estimated Equity
$278,235
Purchase Details
Closed on
Apr 26, 2006
Sold by
Crick Bob and Crick Delynn
Bought by
Angeles Saul and Angeles Margarita
Home Financials for this Owner
Home Financials are based on the most recent Mortgage that was taken out on this home.
Original Mortgage
$143,600
Interest Rate
6.33%
Mortgage Type
Fannie Mae Freddie Mac
Purchase Details
Closed on
Jul 29, 2004
Sold by
Irrevocable Crick Verletta
Bought by
Crick Bob and Crick Delynn
Purchase Details
Closed on
May 15, 1997
Sold by
Crick Verle Oliver
Bought by
Sobell Verletta S
Create a Home Valuation Report for This Property
The Home Valuation Report is an in-depth analysis detailing your home's value as well as a comparison with similar homes in the area
Home Values in the Area
Average Home Value in this Area
Purchase History
| Date | Buyer | Sale Price | Title Company |
|---|---|---|---|
| Gonzalez Jose | -- | None Available | |
| Angeles Saul | -- | Stewart Title | |
| Crick Bob | -- | -- | |
| Sobell Verletta S | -- | -- |
Source: Public Records
Mortgage History
| Date | Status | Borrower | Loan Amount |
|---|---|---|---|
| Open | Gonzalez Jose | $274,725 | |
| Previous Owner | Angeles Saul | $143,600 |
Source: Public Records
Tax History Compared to Growth
Tax History
| Year | Tax Paid | Tax Assessment Tax Assessment Total Assessment is a certain percentage of the fair market value that is determined by local assessors to be the total taxable value of land and additions on the property. | Land | Improvement |
|---|---|---|---|---|
| 2025 | $8,969 | $645,955 | $438,259 | $207,696 |
| 2024 | $10,208 | $506,533 | $0 | $0 |
| 2023 | $8,552 | $485,029 | $301,832 | $264,700 |
| 2022 | $7,416 | $323,330 | $142,919 | $180,411 |
| 2021 | $5,661 | $255,287 | $72,266 | $183,021 |
| 2020 | $5,780 | $255,221 | $72,266 | $182,955 |
| 2019 | $6,122 | $253,712 | $72,266 | $181,446 |
| 2018 | $5,481 | $225,979 | $72,266 | $153,713 |
| 2017 | $5,616 | $230,562 | $72,266 | $158,296 |
| 2016 | $5,646 | $231,792 | $72,266 | $159,526 |
| 2015 | $4,171 | $188,756 | $54,199 | $134,557 |
| 2014 | $4,171 | $169,571 | $54,199 | $115,372 |
| 2013 | -- | $173,461 | $54,199 | $119,262 |
Source: Public Records
Map
Nearby Homes
- 5109 Meadow Ln
- 1500 Radecke Rd
- 5266 Meadow Ln
- 5225 Mountain View Dr
- 5213 Meadow Ln
- 1600 Reed Dr
- 3537 Camden Creek Rd
- 3454 Eloise Ln
- 1536 Wagon Wheel Way
- 5254 Crystal Lake Ave
- 198 Radecke Rd
- 1216 E 6th St
- 204 Cory Ct
- 100 Turtle Dove
- 4107 Reese Ln
- 0 Farm To Market Road 1173
- 7272 Christina Ct
- 7257 Christina Ct
- 220 Brook Cir
- TBD E Mccart St