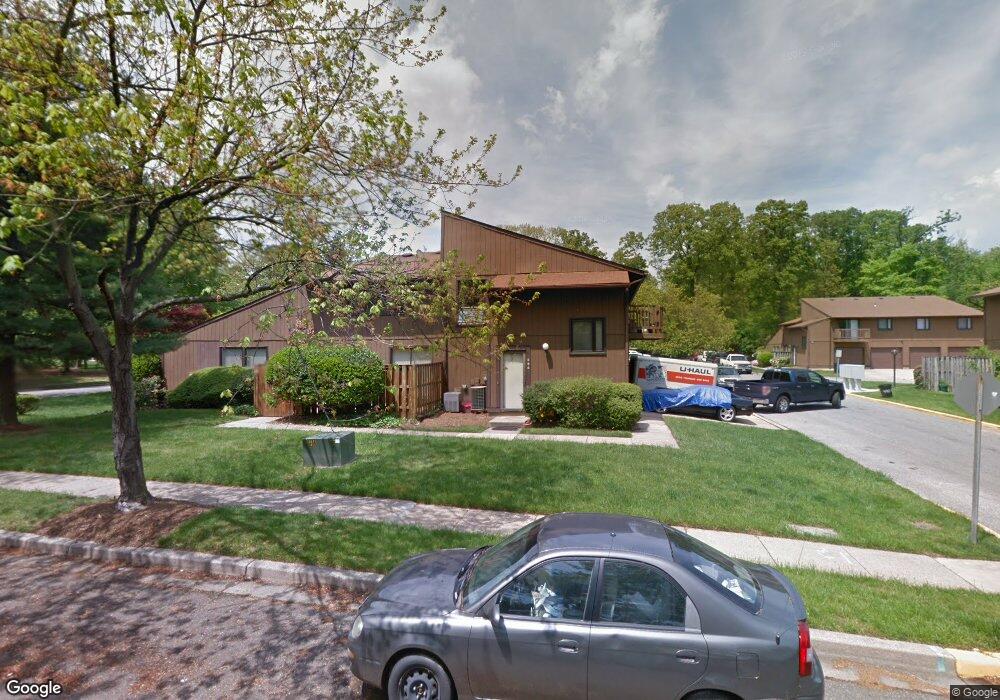
394 West Ct Glen Burnie, MD 21061
Estimated Value: $210,000 - $259,000
3
Beds
1
Bath
1,056
Sq Ft
$227/Sq Ft
Est. Value
About This Home
This home is located at 394 West Ct, Glen Burnie, MD 21061 and is currently estimated at $239,644, approximately $226 per square foot. 394 West Ct is a home located in Anne Arundel County with nearby schools including Quarterfield Elementary School, Corkran Middle School, and Glen Burnie High School.
Ownership History
Date
Name
Owned For
Owner Type
Purchase Details
Closed on
Mar 22, 2016
Sold by
Poole Kevin and Fugh Alveta D
Bought by
Poole Kevin
Current Estimated Value
Home Financials for this Owner
Home Financials are based on the most recent Mortgage that was taken out on this home.
Original Mortgage
$121,700
Outstanding Balance
$52,425
Interest Rate
3.62%
Mortgage Type
New Conventional
Estimated Equity
$187,219
Purchase Details
Closed on
Oct 21, 1997
Sold by
Secretary Of Veterans Affairs
Bought by
Poole Kevin and Fugh Alveta D
Purchase Details
Closed on
May 22, 1997
Sold by
Parrish Helen I
Bought by
Secretary Of Veterans Affairs
Purchase Details
Closed on
Nov 21, 1989
Sold by
Fabian Robert G
Bought by
Parrish Helen I
Home Financials for this Owner
Home Financials are based on the most recent Mortgage that was taken out on this home.
Original Mortgage
$67,650
Interest Rate
9.72%
Create a Home Valuation Report for This Property
The Home Valuation Report is an in-depth analysis detailing your home's value as well as a comparison with similar homes in the area
Home Values in the Area
Average Home Value in this Area
Purchase History
| Date | Buyer | Sale Price | Title Company |
|---|---|---|---|
| Poole Kevin | -- | Resource Real Estate Svcs Ll | |
| Poole Kevin | $58,000 | -- | |
| Secretary Of Veterans Affairs | $64,413 | -- | |
| Parrish Helen I | $67,000 | -- |
Source: Public Records
Mortgage History
| Date | Status | Borrower | Loan Amount |
|---|---|---|---|
| Open | Poole Kevin | $121,700 | |
| Previous Owner | Parrish Helen I | $67,650 | |
| Closed | Poole Kevin | -- |
Source: Public Records
Tax History Compared to Growth
Tax History
| Year | Tax Paid | Tax Assessment Tax Assessment Total Assessment is a certain percentage of the fair market value that is determined by local assessors to be the total taxable value of land and additions on the property. | Land | Improvement |
|---|---|---|---|---|
| 2025 | $1,808 | $202,600 | $75,000 | $127,600 |
| 2024 | $1,808 | $177,033 | $0 | $0 |
| 2023 | $1,740 | $151,467 | $0 | $0 |
| 2022 | $1,316 | $125,900 | $25,000 | $100,900 |
| 2021 | $3,160 | $121,500 | $0 | $0 |
| 2020 | $1,512 | $117,100 | $0 | $0 |
| 2019 | $2,942 | $112,700 | $15,000 | $97,700 |
| 2018 | $1,143 | $112,700 | $15,000 | $97,700 |
| 2017 | $1,508 | $112,700 | $0 | $0 |
| 2016 | -- | $114,500 | $0 | $0 |
| 2015 | -- | $114,500 | $0 | $0 |
| 2014 | -- | $114,500 | $0 | $0 |
Source: Public Records
Map
Nearby Homes