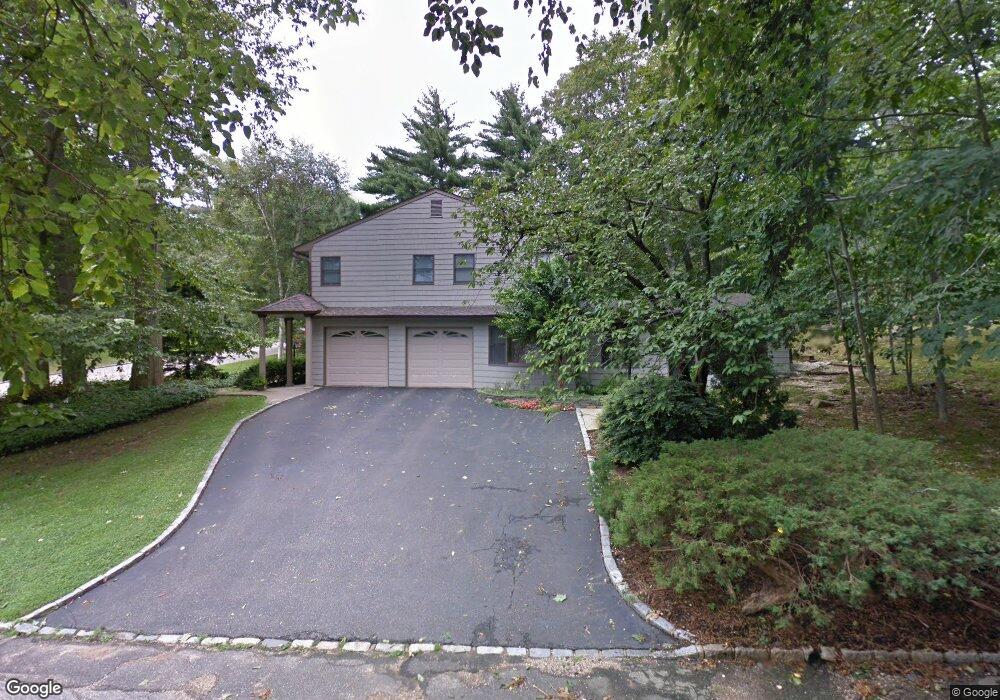
395 Chestnut Dr Roslyn, NY 11576
Estimated Value: $2,263,924 - $2,403,000
--
Bed
4
Baths
4,158
Sq Ft
$561/Sq Ft
Est. Value
About This Home
This home is located at 395 Chestnut Dr, Roslyn, NY 11576 and is currently estimated at $2,333,462, approximately $561 per square foot. 395 Chestnut Dr is a home located in Nassau County with nearby schools including Roslyn Middle School, Roslyn High School, and Henry Viscardi School.
Ownership History
Date
Name
Owned For
Owner Type
Purchase Details
Closed on
Aug 3, 2010
Sold by
Kessler Richard
Bought by
Sonoda Toyooki
Current Estimated Value
Home Financials for this Owner
Home Financials are based on the most recent Mortgage that was taken out on this home.
Original Mortgage
$964,000
Outstanding Balance
$635,123
Interest Rate
4.55%
Mortgage Type
Purchase Money Mortgage
Estimated Equity
$1,698,339
Create a Home Valuation Report for This Property
The Home Valuation Report is an in-depth analysis detailing your home's value as well as a comparison with similar homes in the area
Home Values in the Area
Average Home Value in this Area
Purchase History
| Date | Buyer | Sale Price | Title Company |
|---|---|---|---|
| Sonoda Toyooki | $1,205,000 | -- | |
| Sonoda Toyooki | $1,205,000 | -- | |
| Sonoda Toyooki | $1,205,000 | -- |
Source: Public Records
Mortgage History
| Date | Status | Borrower | Loan Amount |
|---|---|---|---|
| Open | Sonoda Toyooki | $964,000 | |
| Closed | Sonoda Toyooki | $964,000 |
Source: Public Records
Tax History Compared to Growth
Tax History
| Year | Tax Paid | Tax Assessment Tax Assessment Total Assessment is a certain percentage of the fair market value that is determined by local assessors to be the total taxable value of land and additions on the property. | Land | Improvement |
|---|---|---|---|---|
| 2025 | $28,407 | $1,285 | $422 | $863 |
| 2024 | $5,106 | $1,320 | $434 | $886 |
| 2023 | $23,615 | $1,305 | $428 | $877 |
| 2022 | $23,615 | $1,428 | $469 | $959 |
| 2021 | $24,860 | $1,479 | $486 | $993 |
| 2020 | $25,259 | $1,918 | $1,318 | $600 |
| 2019 | $25,114 | $2,055 | $1,246 | $809 |
| 2018 | $25,637 | $2,192 | $0 | $0 |
| 2017 | $21,917 | $2,329 | $1,229 | $1,100 |
| 2016 | $27,263 | $2,675 | $1,412 | $1,263 |
| 2015 | $5,803 | $2,675 | $1,412 | $1,263 |
| 2014 | $5,803 | $2,675 | $1,412 | $1,263 |
| 2013 | $5,540 | $2,675 | $1,412 | $1,263 |
Source: Public Records
Map
Nearby Homes