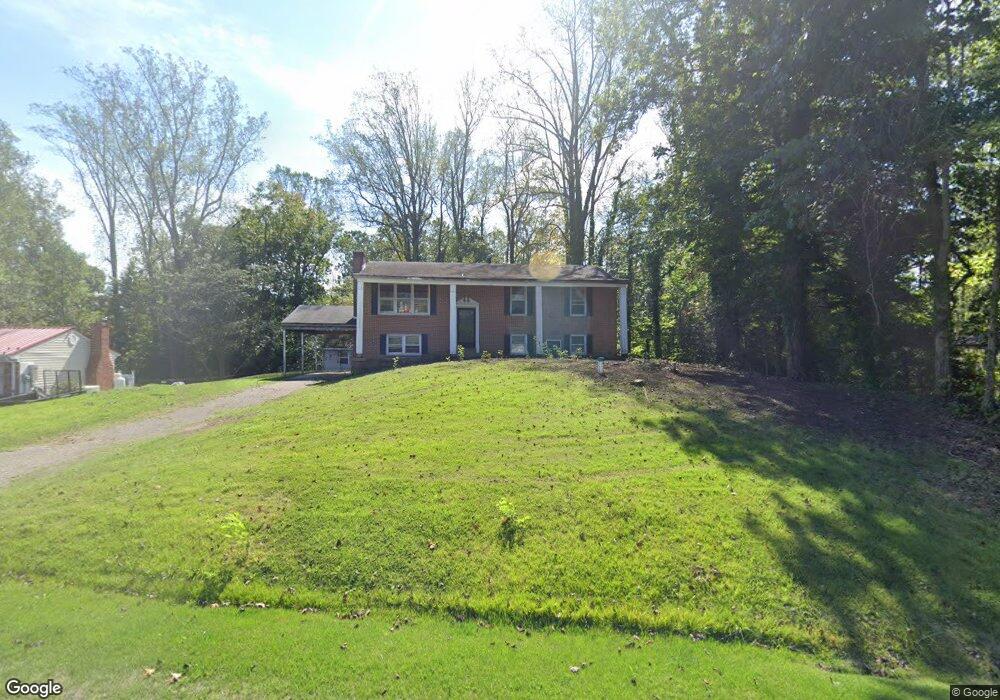
39591 Mason Dr Mechanicsville, MD 20659
Estimated Value: $201,000 - $399,000
--
Bed
3
Baths
1,188
Sq Ft
$246/Sq Ft
Est. Value
About This Home
This home is located at 39591 Mason Dr, Mechanicsville, MD 20659 and is currently estimated at $292,190, approximately $245 per square foot. 39591 Mason Dr is a home located in St. Mary's County with nearby schools including Lettie Marshall Dent Elementary School, Margaret Brent Middle School, and Chopticon High School.
Ownership History
Date
Name
Owned For
Owner Type
Purchase Details
Closed on
Jul 31, 2025
Sold by
Shaffer John L
Bought by
Gar Real Estate Investment Group Llc
Current Estimated Value
Home Financials for this Owner
Home Financials are based on the most recent Mortgage that was taken out on this home.
Original Mortgage
$400,000
Outstanding Balance
$367,694
Interest Rate
6.81%
Mortgage Type
Construction
Estimated Equity
-$75,504
Purchase Details
Closed on
Jul 24, 1990
Sold by
Priest Deborah C
Bought by
Shaffer John L and Shaffer Linda S
Home Financials for this Owner
Home Financials are based on the most recent Mortgage that was taken out on this home.
Original Mortgage
$104,500
Interest Rate
9.99%
Purchase Details
Closed on
Dec 16, 1985
Sold by
Montgomery John
Bought by
Priest Deborah C
Home Financials for this Owner
Home Financials are based on the most recent Mortgage that was taken out on this home.
Original Mortgage
$79,800
Interest Rate
11.31%
Create a Home Valuation Report for This Property
The Home Valuation Report is an in-depth analysis detailing your home's value as well as a comparison with similar homes in the area
Home Values in the Area
Average Home Value in this Area
Purchase History
| Date | Buyer | Sale Price | Title Company |
|---|---|---|---|
| Gar Real Estate Investment Group Llc | $206,000 | Allied Title | |
| Gar Real Estate Investment Group Llc | $206,000 | Allied Title | |
| Shaffer John L | $110,000 | -- | |
| Priest Deborah C | $84,000 | -- |
Source: Public Records
Mortgage History
| Date | Status | Borrower | Loan Amount |
|---|---|---|---|
| Open | Gar Real Estate Investment Group Llc | $400,000 | |
| Closed | Gar Real Estate Investment Group Llc | $400,000 | |
| Previous Owner | Shaffer John L | $104,500 | |
| Previous Owner | Priest Deborah C | $79,800 |
Source: Public Records
Tax History Compared to Growth
Tax History
| Year | Tax Paid | Tax Assessment Tax Assessment Total Assessment is a certain percentage of the fair market value that is determined by local assessors to be the total taxable value of land and additions on the property. | Land | Improvement |
|---|---|---|---|---|
| 2025 | $3,301 | $312,200 | $0 | $0 |
| 2024 | $3,202 | $297,500 | $107,000 | $190,500 |
| 2023 | $3,081 | $287,000 | $0 | $0 |
| 2022 | $2,992 | $276,500 | $0 | $0 |
| 2021 | $2,905 | $266,000 | $100,100 | $165,900 |
| 2020 | $2,821 | $257,033 | $0 | $0 |
| 2019 | $2,740 | $248,067 | $0 | $0 |
| 2018 | $2,647 | $239,100 | $95,100 | $144,000 |
| 2017 | $2,628 | $239,100 | $0 | $0 |
| 2016 | -- | $239,100 | $0 | $0 |
| 2015 | $2,209 | $247,000 | $0 | $0 |
| 2014 | $2,209 | $247,000 | $0 | $0 |
Source: Public Records
Map
Nearby Homes
- 29057 Ann Cir
- 29697 Dogwood Cir
- 29954 Richard Cir
- 29853 Hillview Dr
- 0 Hillview Dr
- 30090 Cherokee Ct
- 29844 Cheryl Ct
- 29813 Scott Cir
- 0 Scott Cir Unit MDSM2027260
- 30087 Cross Woods Dr
- 30130 Huntt Rd
- 40147 Dockser Dr
- 29810 Washington Rd
- 39550 Mount Wolf Rd
- 0 Carol Ln
- 39783 Hearts Desire Ln
- 0 Bay Dr Unit MDSM2025208
- 39352 Wood Duck Ct
- 0 Unknown Unit MDSM2021062
- 39281 Wigeon Place
- 39599 Mason Dr
- 29784 Vincent Cir
- 39572 Walnut Cir
- 39564 Walnut Cir
- 39611 Mason Dr
- 39580 Walnut Cir
- 39596 Mason Dr
- 39588 Mason Dr
- 39608 Mason Dr
- 29781 Vincent Cir
- 39576 Mason Dr
- 29777 Vincent Cir
- 39567 Walnut Cir
- 39630 Mason Dr
- 39564 Mason Dr
- 39575 Walnut Cir
- 39561 Mason Dr
- 29769 Vincent Cir
- 39637 Mason Dr
- 39589 Golden Beach Rd