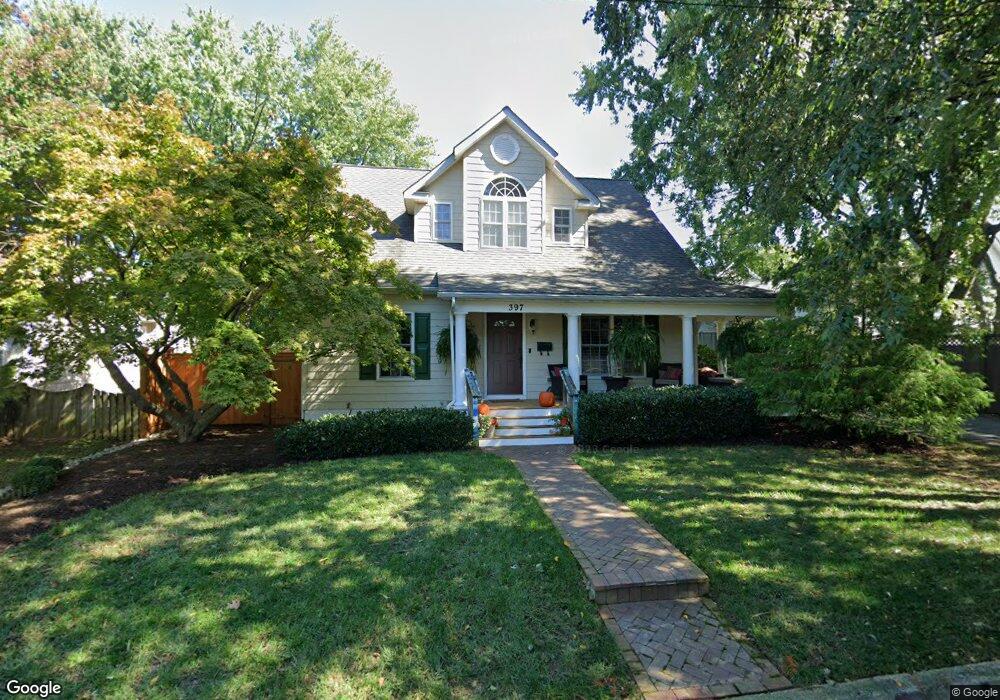
397 Jefferson St Annapolis, MD 21403
Eastport NeighborhoodEstimated Value: $1,188,000 - $1,274,443
--
Bed
3
Baths
2,197
Sq Ft
$558/Sq Ft
Est. Value
About This Home
This home is located at 397 Jefferson St, Annapolis, MD 21403 and is currently estimated at $1,225,861, approximately $557 per square foot. 397 Jefferson St is a home located in Anne Arundel County with nearby schools including Eastport Elementary School, Annapolis Middle School, and Annapolis High School.
Ownership History
Date
Name
Owned For
Owner Type
Purchase Details
Closed on
Sep 14, 2016
Bought by
Tuesdi Knight
Current Estimated Value
Home Financials for this Owner
Home Financials are based on the most recent Mortgage that was taken out on this home.
Original Mortgage
$652,900
Outstanding Balance
$521,679
Interest Rate
3.44%
Estimated Equity
$704,182
Purchase Details
Closed on
May 28, 2009
Sold by
Witten Kristopher L
Bought by
Witten Kristopher L and Knight Tuesdi
Home Financials for this Owner
Home Financials are based on the most recent Mortgage that was taken out on this home.
Original Mortgage
$380,400
Interest Rate
4.9%
Mortgage Type
New Conventional
Purchase Details
Closed on
Nov 24, 2004
Sold by
Annapolis Property Consultants Inc
Bought by
Witten Kristopher L
Purchase Details
Closed on
Feb 28, 2003
Sold by
Riley Richard M
Bought by
Annapolis Property Consultants Inc
Purchase Details
Closed on
Nov 5, 2001
Sold by
Morgan Ii James H
Bought by
Riley Richard M
Create a Home Valuation Report for This Property
The Home Valuation Report is an in-depth analysis detailing your home's value as well as a comparison with similar homes in the area
Home Values in the Area
Average Home Value in this Area
Purchase History
| Date | Buyer | Sale Price | Title Company |
|---|---|---|---|
| Tuesdi Knight | -- | -- | |
| Witten Kristopher L | -- | -- | |
| Witten Kristopher L | $690,000 | -- | |
| Annapolis Property Consultants Inc | $227,000 | -- | |
| Riley Richard M | $112,500 | -- |
Source: Public Records
Mortgage History
| Date | Status | Borrower | Loan Amount |
|---|---|---|---|
| Open | Tuesdi Knight | $652,900 | |
| Closed | Tuesdi Knight | -- | |
| Previous Owner | Witten Kristopher L | $380,400 | |
| Closed | Riley Richard M | -- |
Source: Public Records
Tax History Compared to Growth
Tax History
| Year | Tax Paid | Tax Assessment Tax Assessment Total Assessment is a certain percentage of the fair market value that is determined by local assessors to be the total taxable value of land and additions on the property. | Land | Improvement |
|---|---|---|---|---|
| 2025 | $10,771 | $977,767 | -- | -- |
| 2024 | $10,771 | $917,633 | $0 | $0 |
| 2023 | $10,196 | $857,500 | $444,700 | $412,800 |
| 2022 | $9,937 | $849,167 | $0 | $0 |
| 2021 | $9,694 | $840,833 | $0 | $0 |
| 2020 | $9,694 | $832,500 | $443,500 | $389,000 |
| 2019 | $9,139 | $772,633 | $0 | $0 |
| 2018 | $8,490 | $712,767 | $0 | $0 |
| 2017 | $7,365 | $652,900 | $0 | $0 |
| 2016 | -- | $618,700 | $0 | $0 |
| 2015 | -- | $584,500 | $0 | $0 |
| 2014 | -- | $550,300 | $0 | $0 |
Source: Public Records
Map
Nearby Homes
- 412 Jefferson St
- 1007 Park Ave
- 10 Sailors Way
- 934 Bay Ridge Ave Unit 308
- 8 Spa Creek Landing Unit B1 A1
- 289 State St Unit 4
- 287 State St Unit 3
- 287 State St Unit 2
- 316 Burnside St Unit 101
- 14 Spa Creek Landing Unit B1
- 301 Burnside St Unit C 202
- 1 Shipwright Harbor
- 2 Southgate Ave Unit 10
- 9 Shipwright St
- 1004 Primrose Rd
- 51 Richards Ln
- 39 Southgate Ave
- 168 Green St
- 13 Elliott Rd
- 51 Franklin St
- 395 Jefferson St
- 932 Windsor Ave
- 398 Jefferson St
- 926 Windsor Ave
- 392 Jefferson St
- 924 Windsor Ave
- 935 Boucher Ave
- 931 Boucher Ave
- 922 Windsor Ave
- 1021 Boucher Ave
- 396 Jefferson St
- 927 Boucher Ave
- 390 Jefferson St
- 400 Jefferson St
- 925 Boucher Ave
- 916 Windsor Ave
- 927 Windsor Ave
- 925 Windsor Ave
- 1023 Boucher Ave
- 402 Jefferson St