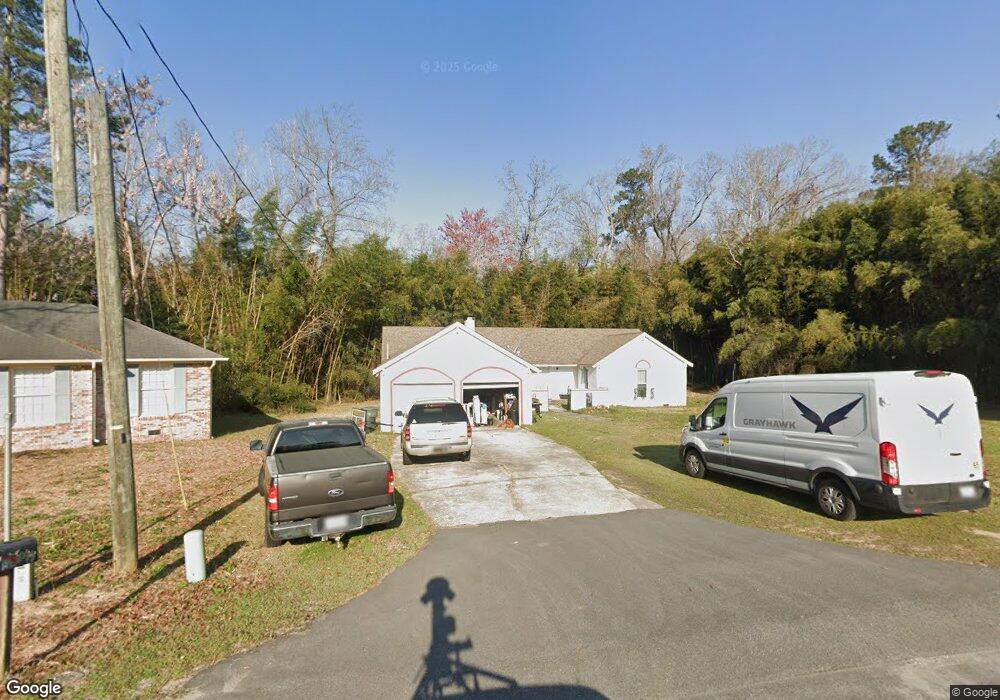
398 Northridge St Orangeburg, SC 29118
Estimated Value: $193,000 - $243,000
3
Beds
2
Baths
1,899
Sq Ft
$118/Sq Ft
Est. Value
About This Home
This home is located at 398 Northridge St, Orangeburg, SC 29118 and is currently estimated at $223,511, approximately $117 per square foot. 398 Northridge St is a home located in Orangeburg County with nearby schools including Marshall Elementary School, Marshall Elementary, and William J. Clark Middle School.
Ownership History
Date
Name
Owned For
Owner Type
Purchase Details
Closed on
Aug 30, 2012
Sold by
Jones Joseph L and Jones Leslie Joy
Bought by
Lowden Xevilon N
Current Estimated Value
Home Financials for this Owner
Home Financials are based on the most recent Mortgage that was taken out on this home.
Original Mortgage
$78,551
Outstanding Balance
$53,527
Interest Rate
3.25%
Mortgage Type
FHA
Estimated Equity
$169,984
Purchase Details
Closed on
Aug 20, 2010
Sold by
Jones Joseph L
Bought by
Jones Leslie Joy and Jones James Richard
Purchase Details
Closed on
Apr 1, 2010
Sold by
Estate Of Joy Hodge Jones and Jones Leslie J
Bought by
Jones Leslie Joy and Jones Jason Theodore
Create a Home Valuation Report for This Property
The Home Valuation Report is an in-depth analysis detailing your home's value as well as a comparison with similar homes in the area
Home Values in the Area
Average Home Value in this Area
Purchase History
| Date | Buyer | Sale Price | Title Company |
|---|---|---|---|
| Lowden Xevilon N | $80,000 | -- | |
| Jones Leslie Joy | -- | -- | |
| Jones Leslie Joy | -- | -- |
Source: Public Records
Mortgage History
| Date | Status | Borrower | Loan Amount |
|---|---|---|---|
| Open | Lowden Xevilon N | $78,551 |
Source: Public Records
Tax History Compared to Growth
Tax History
| Year | Tax Paid | Tax Assessment Tax Assessment Total Assessment is a certain percentage of the fair market value that is determined by local assessors to be the total taxable value of land and additions on the property. | Land | Improvement |
|---|---|---|---|---|
| 2024 | $1,672 | $6,941 | $677 | $6,264 |
| 2023 | $1,494 | $5,121 | $637 | $4,484 |
| 2022 | $1,392 | $5,121 | $637 | $4,484 |
| 2021 | $1,381 | $5,121 | $637 | $4,484 |
| 2020 | $1,361 | $5,121 | $637 | $4,484 |
| 2019 | $1,366 | $5,121 | $637 | $4,484 |
| 2018 | $1,243 | $4,877 | $637 | $4,240 |
| 2017 | $1,194 | $4,877 | $0 | $0 |
| 2016 | $1,194 | $4,877 | $0 | $0 |
| 2015 | $696 | $4,877 | $0 | $0 |
| 2014 | $696 | $4,878 | $638 | $4,240 |
| 2013 | -- | $4,661 | $637 | $4,024 |
Source: Public Records
Map
Nearby Homes
- 0 S Circle Dr NW
- 3058 Broughton St
- 0 Old Riley St
- 2249 Chestnut St
- 772 Hillsboro Rd
- 238 Club Acres Blvd
- 2160 Chestnut St
- 147 Cloister Cove Ln
- 2320 Mall Terrace Ct Unit 2320
- 2348 Northview Dr Unit 3F
- 2336 Northview Dr Unit 3-C
- 2354 Northview Dr Unit 2A
- 2358 Northview Dr Unit 2B
- 2069 Hydrick Ave
- 2251 Hillcrest Ave Unit 6C
- 943 Spring Hill Ln
- 1611 Sunset St
- 481 Rutledge Ave
- 2018 Griffith Dr NW
- 1571 Green Valley St
- 430 Northridge St
- 397 Northridge St
- 220 Plantation Dr
- 334 Northridge St
- 270 Plantation Dr
- 396 Plantation Dr
- 294 Plantation Dr
- 294 Plantation Dr Unit 34
- 2053 Chelsea Close Rd
- 496 Northridge St
- 265 Plantation Dr
- 524 Northridge St
- 373 Plantation Dr
- 347 Plantation Dr
- 399 Plantation Dr
- 2034 Chelsea Close Rd
- 297 Plantation Dr
- 321 Plantation Dr
- 1731 Old Riley St
- 1724 Old Riley St