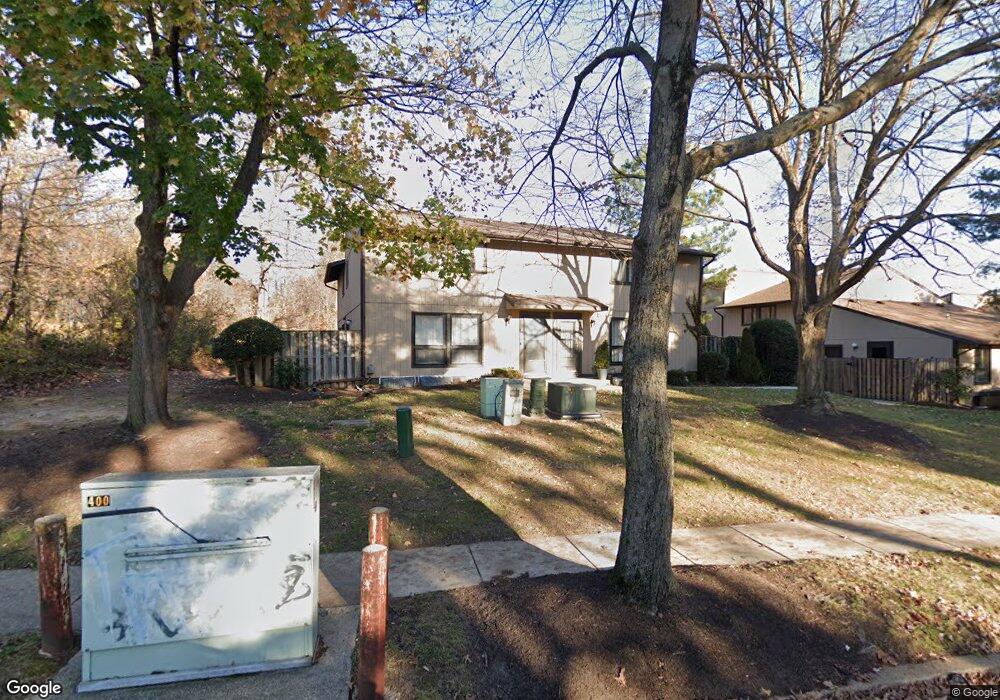
398 West Ct Glen Burnie, MD 21061
Estimated Value: $221,000 - $261,000
--
Bed
1
Bath
1,056
Sq Ft
$232/Sq Ft
Est. Value
About This Home
This home is located at 398 West Ct, Glen Burnie, MD 21061 and is currently estimated at $244,700, approximately $231 per square foot. 398 West Ct is a home located in Anne Arundel County with nearby schools including Quarterfield Elementary School, Corkran Middle School, and Glen Burnie High School.
Ownership History
Date
Name
Owned For
Owner Type
Purchase Details
Closed on
Jun 15, 2004
Sold by
Wescott Breton C
Bought by
Dandy Manuela
Current Estimated Value
Purchase Details
Closed on
Aug 7, 1998
Sold by
Payne Susan E
Bought by
Westcott Breton C and Wesscott Cynthia J
Purchase Details
Closed on
Nov 1, 1991
Sold by
Sherman Rebecca K
Bought by
Payne Susan E
Home Financials for this Owner
Home Financials are based on the most recent Mortgage that was taken out on this home.
Original Mortgage
$57,000
Interest Rate
8.78%
Create a Home Valuation Report for This Property
The Home Valuation Report is an in-depth analysis detailing your home's value as well as a comparison with similar homes in the area
Home Values in the Area
Average Home Value in this Area
Purchase History
| Date | Buyer | Sale Price | Title Company |
|---|---|---|---|
| Dandy Manuela | $124,000 | -- | |
| Westcott Breton C | $79,000 | -- | |
| Payne Susan E | $77,000 | -- |
Source: Public Records
Mortgage History
| Date | Status | Borrower | Loan Amount |
|---|---|---|---|
| Previous Owner | Payne Susan E | $57,000 | |
| Closed | Westcott Breton C | -- |
Source: Public Records
Tax History Compared to Growth
Tax History
| Year | Tax Paid | Tax Assessment Tax Assessment Total Assessment is a certain percentage of the fair market value that is determined by local assessors to be the total taxable value of land and additions on the property. | Land | Improvement |
|---|---|---|---|---|
| 2025 | $2,336 | $201,500 | $75,000 | $126,500 |
| 2024 | $2,336 | $175,967 | $0 | $0 |
| 2023 | $2,028 | $150,433 | $0 | $0 |
| 2022 | $1,305 | $124,900 | $25,000 | $99,900 |
| 2021 | $3,210 | $120,467 | $0 | $0 |
| 2020 | $1,517 | $116,033 | $0 | $0 |
| 2019 | $2,912 | $111,600 | $15,000 | $96,600 |
| 2018 | $1,132 | $111,600 | $15,000 | $96,600 |
| 2017 | $1,497 | $111,600 | $0 | $0 |
| 2016 | -- | $113,400 | $0 | $0 |
| 2015 | -- | $113,400 | $0 | $0 |
| 2014 | -- | $113,400 | $0 | $0 |
Source: Public Records
Map
Nearby Homes