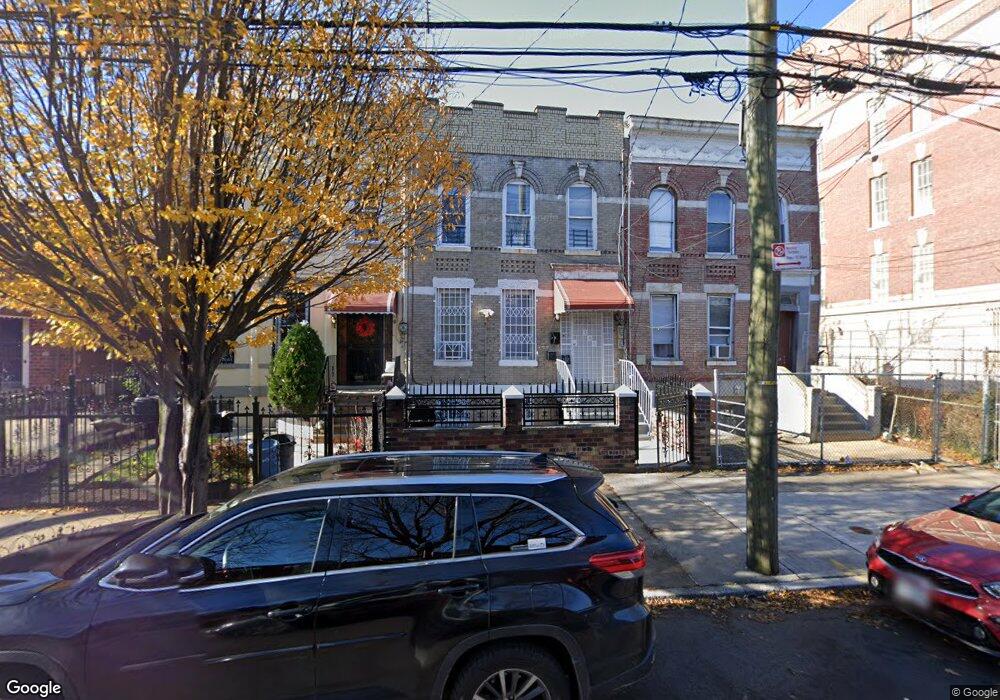
398 Wyona St Brooklyn, NY 11207
East New York NeighborhoodEstimated Value: $733,598 - $851,000
--
Bed
--
Bath
2,000
Sq Ft
$405/Sq Ft
Est. Value
About This Home
This home is located at 398 Wyona St, Brooklyn, NY 11207 and is currently estimated at $810,900, approximately $405 per square foot. 398 Wyona St is a home located in Kings County with nearby schools including P.S. 149 Danny Kaye, J.H.S 292 Margaret S. Douglas, and Hyde Leadership Charter School-Brooklyn.
Ownership History
Date
Name
Owned For
Owner Type
Purchase Details
Closed on
Nov 23, 2005
Sold by
Beckford Lloyd
Bought by
Edouard Jean
Current Estimated Value
Home Financials for this Owner
Home Financials are based on the most recent Mortgage that was taken out on this home.
Original Mortgage
$42,000
Outstanding Balance
$23,195
Interest Rate
6.17%
Estimated Equity
$787,705
Purchase Details
Closed on
Jul 6, 2005
Sold by
Elena Maya Maria
Bought by
Hosein Shazin
Home Financials for this Owner
Home Financials are based on the most recent Mortgage that was taken out on this home.
Original Mortgage
$486,000
Interest Rate
5.67%
Mortgage Type
Purchase Money Mortgage
Purchase Details
Closed on
Aug 26, 1998
Sold by
Rollizo Berta
Bought by
Beckford Lloyd
Home Financials for this Owner
Home Financials are based on the most recent Mortgage that was taken out on this home.
Original Mortgage
$137,750
Interest Rate
6.49%
Create a Home Valuation Report for This Property
The Home Valuation Report is an in-depth analysis detailing your home's value as well as a comparison with similar homes in the area
Home Values in the Area
Average Home Value in this Area
Purchase History
| Date | Buyer | Sale Price | Title Company |
|---|---|---|---|
| Edouard Jean | $420,000 | -- | |
| Edouard Jean | $420,000 | -- | |
| Hosein Shazin | $540,000 | -- | |
| Hosein Shazin | $540,000 | -- | |
| Beckford Lloyd | $145,000 | -- | |
| Beckford Lloyd | $145,000 | -- |
Source: Public Records
Mortgage History
| Date | Status | Borrower | Loan Amount |
|---|---|---|---|
| Open | Edouard Jean | $42,000 | |
| Closed | Edouard Jean | $42,000 | |
| Open | Edouard Jean | $336,000 | |
| Closed | Edouard Jean | $336,000 | |
| Previous Owner | Hosein Shazin | $486,000 | |
| Previous Owner | Beckford Lloyd | $137,750 |
Source: Public Records
Tax History Compared to Growth
Tax History
| Year | Tax Paid | Tax Assessment Tax Assessment Total Assessment is a certain percentage of the fair market value that is determined by local assessors to be the total taxable value of land and additions on the property. | Land | Improvement |
|---|---|---|---|---|
| 2025 | $2,216 | $52,320 | $20,040 | $32,280 |
| 2024 | $2,216 | $45,660 | $20,040 | $25,620 |
| 2023 | $2,117 | $53,880 | $20,040 | $33,840 |
| 2022 | $1,967 | $44,100 | $20,040 | $24,060 |
| 2021 | $1,960 | $44,220 | $20,040 | $24,180 |
| 2020 | $974 | $41,940 | $20,040 | $21,900 |
| 2019 | $1,924 | $46,380 | $20,040 | $26,340 |
| 2018 | $1,771 | $8,686 | $4,843 | $3,843 |
| 2017 | $1,674 | $8,210 | $6,576 | $1,634 |
| 2016 | $1,551 | $7,761 | $5,290 | $2,471 |
| 2015 | $934 | $7,761 | $5,327 | $2,434 |
| 2014 | $934 | $7,663 | $5,109 | $2,554 |
Source: Public Records
Map
Nearby Homes
- 412 Bradford St
- 439 Vermont St
- 342 Wyona St
- 440 Miller Ave
- 443 Miller Ave
- 667 Sutter Ave
- 663 Sutter Ave
- 402 van Siclen Ave
- 477 Vermont St
- 459 Belmont Ave
- 444 New Jersey Ave
- 774 Blake Ave
- 358 van Siclen Ave
- 419 van Siclen Ave
- 486 Vermont St
- 353 Pennsylvania Ave
- 317 Pennsylvania Ave
- 346 van Siclen Ave
- 297 Pennsylvania Ave
- 481 van Siclen Ave