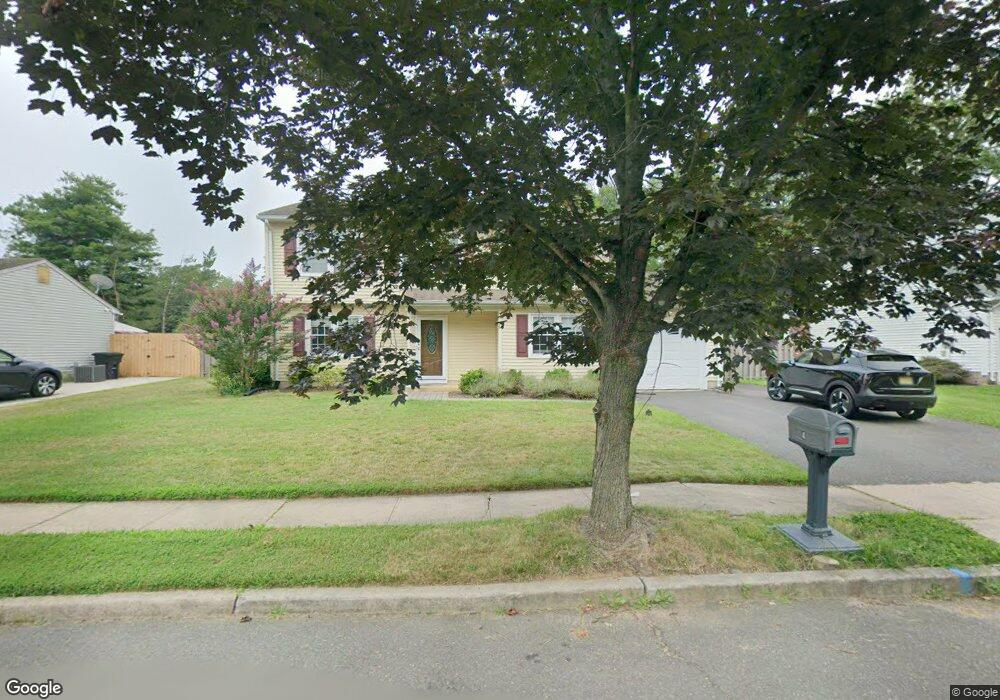
4 Oberman Ln Monmouth Junction, NJ 08852
Estimated Value: $533,332 - $655,000
--
Bed
--
Bath
1,686
Sq Ft
$366/Sq Ft
Est. Value
About This Home
This home is located at 4 Oberman Ln, Monmouth Junction, NJ 08852 and is currently estimated at $617,083, approximately $366 per square foot. 4 Oberman Ln is a home located in Middlesex County with nearby schools including Brooks Crossing Elementary School, Crossroads North Middle School, and South Brunswick High School.
Ownership History
Date
Name
Owned For
Owner Type
Purchase Details
Closed on
Jan 10, 2020
Sold by
Katzenback Robert R and Katzenback Darlene
Bought by
Detig Robert Joseph and Detig Melissa Erin
Current Estimated Value
Home Financials for this Owner
Home Financials are based on the most recent Mortgage that was taken out on this home.
Original Mortgage
$300,000
Outstanding Balance
$265,062
Interest Rate
3.6%
Mortgage Type
New Conventional
Estimated Equity
$352,021
Purchase Details
Closed on
Dec 26, 1984
Bought by
Katzenback Robert R and Katzenback Darlene
Create a Home Valuation Report for This Property
The Home Valuation Report is an in-depth analysis detailing your home's value as well as a comparison with similar homes in the area
Home Values in the Area
Average Home Value in this Area
Purchase History
| Date | Buyer | Sale Price | Title Company |
|---|---|---|---|
| Detig Robert Joseph | $320,000 | Allied Title Llc Suite | |
| Katzenback Robert R | $90,300 | -- |
Source: Public Records
Mortgage History
| Date | Status | Borrower | Loan Amount |
|---|---|---|---|
| Open | Detig Robert Joseph | $300,000 |
Source: Public Records
Tax History Compared to Growth
Tax History
| Year | Tax Paid | Tax Assessment Tax Assessment Total Assessment is a certain percentage of the fair market value that is determined by local assessors to be the total taxable value of land and additions on the property. | Land | Improvement |
|---|---|---|---|---|
| 2025 | $9,497 | $175,800 | $68,000 | $107,800 |
| 2024 | $9,156 | $175,800 | $68,000 | $107,800 |
| 2023 | $9,156 | $175,800 | $68,000 | $107,800 |
| 2022 | $8,883 | $175,800 | $68,000 | $107,800 |
| 2021 | $6,191 | $175,800 | $68,000 | $107,800 |
| 2020 | $8,688 | $175,800 | $68,000 | $107,800 |
| 2019 | $8,769 | $175,800 | $68,000 | $107,800 |
| 2018 | $8,473 | $175,800 | $68,000 | $107,800 |
| 2017 | $8,461 | $175,800 | $68,000 | $107,800 |
| 2016 | $8,619 | $175,800 | $68,000 | $107,800 |
| 2015 | $8,106 | $175,800 | $68,000 | $107,800 |
| 2014 | $7,970 | $175,800 | $68,000 | $107,800 |
Source: Public Records
Map
Nearby Homes