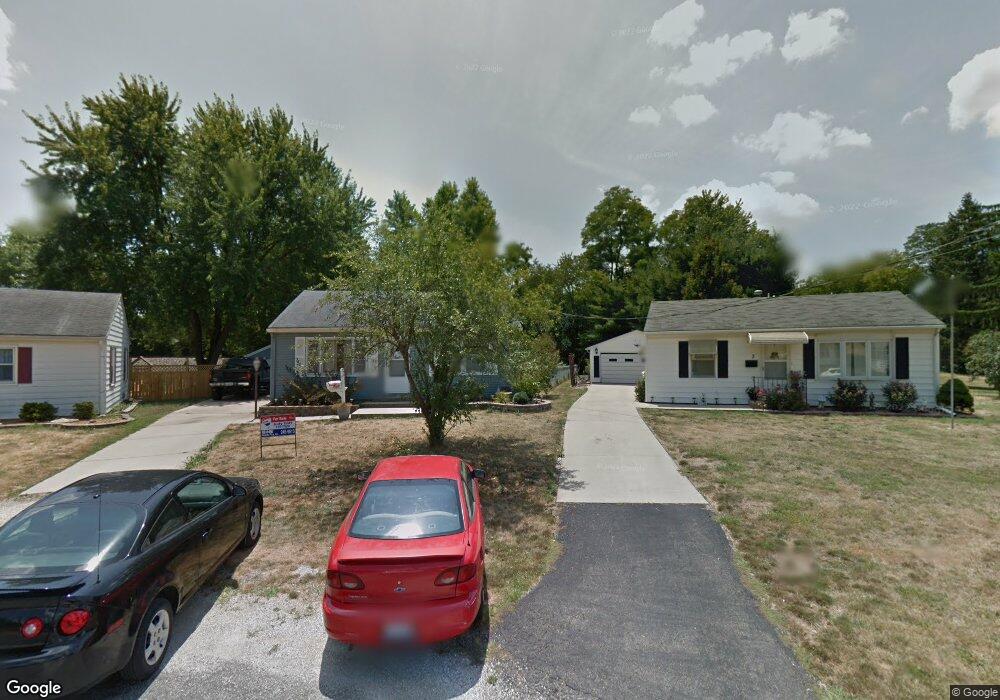
4 Passavant Ct Jacksonville, IL 62650
Estimated Value: $132,000 - $138,281
2
Beds
1
Bath
1,588
Sq Ft
$85/Sq Ft
Est. Value
About This Home
This home is located at 4 Passavant Ct, Jacksonville, IL 62650 and is currently estimated at $134,820, approximately $84 per square foot. 4 Passavant Ct is a home located in Morgan County with nearby schools including Jacksonville High School and Westfair Christian Academy.
Ownership History
Date
Name
Owned For
Owner Type
Purchase Details
Closed on
May 21, 2010
Sold by
Defrates Adam T and Defrates Brandi N
Bought by
Hallock Sharon E
Current Estimated Value
Home Financials for this Owner
Home Financials are based on the most recent Mortgage that was taken out on this home.
Original Mortgage
$102,618
Outstanding Balance
$69,617
Interest Rate
5.3%
Mortgage Type
FHA
Estimated Equity
$65,203
Purchase Details
Closed on
Feb 19, 2009
Sold by
Defrates Adam T
Bought by
Defrates Adam T and Defrates Brandi N
Home Financials for this Owner
Home Financials are based on the most recent Mortgage that was taken out on this home.
Original Mortgage
$79,365
Interest Rate
4.91%
Mortgage Type
FHA
Purchase Details
Closed on
Jan 4, 2005
Sold by
Mcculloch January D and Mcculloch Brett A
Bought by
Defrates Adam T
Home Financials for this Owner
Home Financials are based on the most recent Mortgage that was taken out on this home.
Original Mortgage
$80,000
Interest Rate
5.78%
Mortgage Type
New Conventional
Create a Home Valuation Report for This Property
The Home Valuation Report is an in-depth analysis detailing your home's value as well as a comparison with similar homes in the area
Home Values in the Area
Average Home Value in this Area
Purchase History
| Date | Buyer | Sale Price | Title Company |
|---|---|---|---|
| Hallock Sharon E | $104,000 | Illinois Real Estate Title C | |
| Defrates Adam T | -- | None Available | |
| Defrates Adam T | $26,667 | None Available |
Source: Public Records
Mortgage History
| Date | Status | Borrower | Loan Amount |
|---|---|---|---|
| Open | Hallock Sharon E | $102,618 | |
| Previous Owner | Defrates Adam T | $79,365 | |
| Previous Owner | Defrates Adam T | $80,000 |
Source: Public Records
Tax History Compared to Growth
Tax History
| Year | Tax Paid | Tax Assessment Tax Assessment Total Assessment is a certain percentage of the fair market value that is determined by local assessors to be the total taxable value of land and additions on the property. | Land | Improvement |
|---|---|---|---|---|
| 2024 | $2,802 | $38,310 | $3,880 | $34,430 |
| 2023 | $2,955 | $37,350 | $3,880 | $33,470 |
| 2022 | $2,538 | $32,640 | $3,880 | $28,760 |
| 2021 | $2,410 | $31,840 | $3,880 | $27,960 |
| 2020 | $2,357 | $30,630 | $3,880 | $26,750 |
| 2019 | $2,256 | $29,730 | $4,080 | $25,650 |
| 2018 | $2,117 | $29,230 | $4,080 | $25,150 |
| 2017 | $1,955 | $27,940 | $4,070 | $23,870 |
| 2016 | $2,179 | $30,200 | $3,510 | $26,690 |
| 2015 | $2,146 | $29,320 | $3,410 | $25,910 |
| 2014 | $2,146 | $29,320 | $3,410 | $25,910 |
| 2013 | $2,015 | $29,320 | $3,410 | $25,910 |
Source: Public Records
Map
Nearby Homes
- 1492 Passavant Dr
- 1 Wadsworth Dr
- 15A Shenandoah Ave
- 8 Wadsworth Dr
- 508 N Webster Ave
- 610 Sandusky St
- 290 Finley St
- 1305 W Lafayette Ave
- 13 Morningside Dr
- 33 Windrush Dr
- 231 N Webster Ave
- 411 Caldwell St
- 8 Duncan Park
- 70 Applebee Farms Dr
- 17 Merrygrove Dr
- 8 Westfair Dr
- 840 W Walnut St
- 1136 W State St
- 144 Caldwell St
- 1325 W College Ave
- 3 Passavant Ct
- 5 Passavant Ct
- 2 Passavant Ct
- 6 Passavant Ct
- 8 Gettysburg Dr
- 7 Passavant Ct
- 10 Gettysburg Dr
- 8 Gettysburg Dr
- 1 Passavant Ct
- 10 Gettysburg Dr
- 6 Gettysburg Dr Unit B
- 4 Gettysburg Dr
- 12 Gettysburg Dr Unit B
- 12 Gettysburg Dr Unit A
- 12 A Gettysburg Dr
- 1489 Passavant Dr
- 8 Passavant Ct
- 1477 Passavant Dr
- 2 Gettysburg Dr
- 1491 Passavant Dr