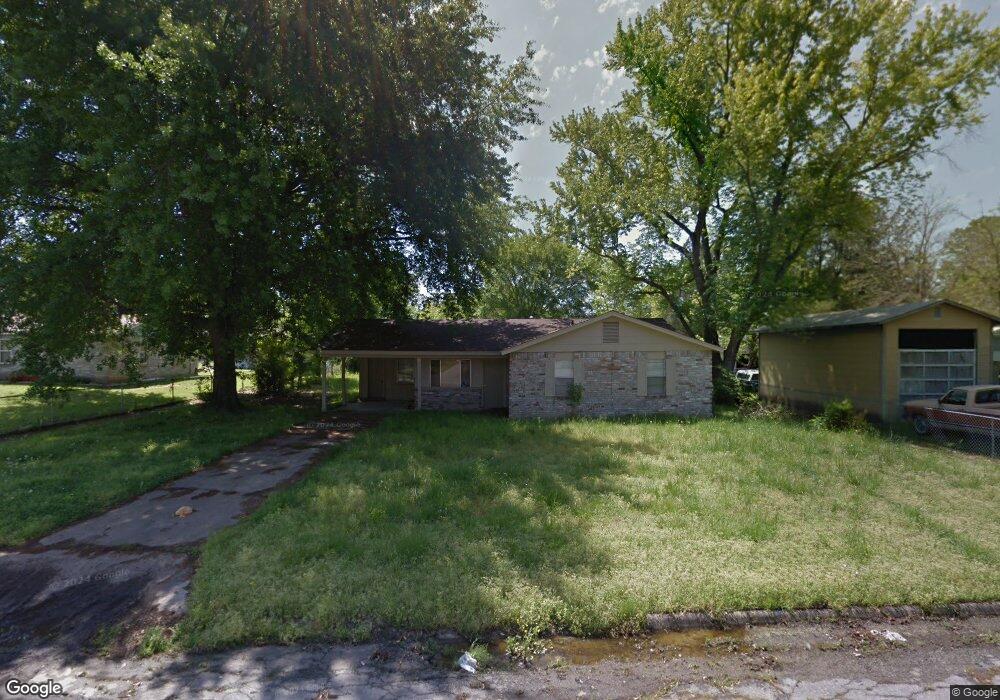
4 S 42nd St van Buren, AR 72956
Estimated Value: $113,000 - $155,000
4
Beds
2
Baths
1,407
Sq Ft
$97/Sq Ft
Est. Value
About This Home
This home is located at 4 S 42nd St, van Buren, AR 72956 and is currently estimated at $136,249, approximately $96 per square foot. 4 S 42nd St is a home located in Crawford County with nearby schools including James R. Tate Elementary School, Butterfield Trail Middle School, and Van Buren High School.
Ownership History
Date
Name
Owned For
Owner Type
Purchase Details
Closed on
Nov 20, 2014
Sold by
Bank Of America Na
Bought by
Port City Properties Llc
Current Estimated Value
Purchase Details
Closed on
Oct 7, 2014
Sold by
Perrari Kasey R and Mooney Timothy W
Bought by
Bank Of America Na
Purchase Details
Closed on
Mar 26, 2010
Sold by
Ellison Donald and Ellison Bonnie
Bought by
Mooney Timothy W and Ferrari Kasey
Home Financials for this Owner
Home Financials are based on the most recent Mortgage that was taken out on this home.
Original Mortgage
$72,293
Interest Rate
5.5%
Mortgage Type
FHA
Purchase Details
Closed on
Sep 14, 2009
Sold by
Oliver Cynthia J Landers and Oliver George
Bought by
Ellison Donald and Ellison Bonnie
Purchase Details
Closed on
Aug 22, 2003
Bought by
Landers-Landers and Landers
Create a Home Valuation Report for This Property
The Home Valuation Report is an in-depth analysis detailing your home's value as well as a comparison with similar homes in the area
Home Values in the Area
Average Home Value in this Area
Purchase History
| Date | Buyer | Sale Price | Title Company |
|---|---|---|---|
| Port City Properties Llc | -- | None Available | |
| Bank Of America Na | $64,901 | None Available | |
| Mooney Timothy W | $75,000 | -- | |
| Ellison Donald | $45,848 | -- | |
| Landers-Landers | -- | -- |
Source: Public Records
Mortgage History
| Date | Status | Borrower | Loan Amount |
|---|---|---|---|
| Previous Owner | Mooney Timothy W | $72,293 |
Source: Public Records
Tax History Compared to Growth
Tax History
| Year | Tax Paid | Tax Assessment Tax Assessment Total Assessment is a certain percentage of the fair market value that is determined by local assessors to be the total taxable value of land and additions on the property. | Land | Improvement |
|---|---|---|---|---|
| 2025 | $764 | $20,000 | $3,000 | $17,000 |
| 2024 | $706 | $20,000 | $3,000 | $17,000 |
| 2023 | $647 | $20,000 | $3,000 | $17,000 |
| 2022 | $588 | $11,328 | $2,000 | $9,328 |
| 2021 | $588 | $11,328 | $2,000 | $9,328 |
| 2020 | $588 | $11,328 | $2,000 | $9,328 |
| 2019 | $588 | $11,328 | $2,000 | $9,328 |
| 2018 | $588 | $11,328 | $2,000 | $9,328 |
| 2017 | $712 | $13,720 | $2,000 | $11,720 |
| 2016 | $712 | $13,720 | $2,000 | $11,720 |
| 2015 | $671 | $14,610 | $2,000 | $12,610 |
| 2014 | -- | $14,610 | $2,000 | $12,610 |
Source: Public Records
Map
Nearby Homes