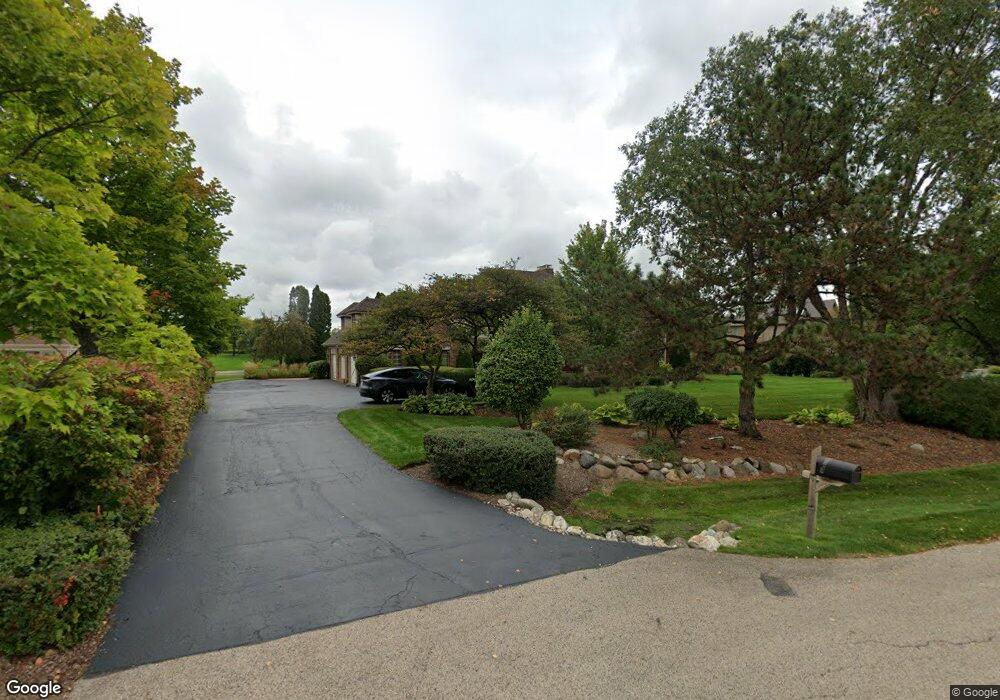
4 S Cove Dr South Barrington, IL 60010
Estimated Value: $1,257,000 - $1,636,000
5
Beds
5
Baths
5,054
Sq Ft
$280/Sq Ft
Est. Value
About This Home
This home is located at 4 S Cove Dr, South Barrington, IL 60010 and is currently estimated at $1,415,206, approximately $280 per square foot. 4 S Cove Dr is a home located in Cook County with nearby schools including Barbara B. Rose Elementary School, Barrington Middle School Station Campus, and Barrington High School.
Ownership History
Date
Name
Owned For
Owner Type
Purchase Details
Closed on
Jun 22, 2017
Sold by
Larsen Dane P and Larsen Mary J
Bought by
Kim James B and Kim Mikyung
Current Estimated Value
Home Financials for this Owner
Home Financials are based on the most recent Mortgage that was taken out on this home.
Original Mortgage
$691,125
Outstanding Balance
$560,140
Interest Rate
3.12%
Mortgage Type
Adjustable Rate Mortgage/ARM
Estimated Equity
$855,066
Purchase Details
Closed on
Feb 16, 2010
Sold by
Larsen Dane P and Daubach Mary J
Bought by
Larsen Dane P and Larsen Mary J
Home Financials for this Owner
Home Financials are based on the most recent Mortgage that was taken out on this home.
Original Mortgage
$593,000
Interest Rate
5.01%
Mortgage Type
New Conventional
Purchase Details
Closed on
May 26, 2005
Sold by
Smith Gary and Smith Lucille
Bought by
Larsen Dane P and Daubach Mary J
Home Financials for this Owner
Home Financials are based on the most recent Mortgage that was taken out on this home.
Original Mortgage
$700,000
Interest Rate
5.87%
Mortgage Type
Fannie Mae Freddie Mac
Create a Home Valuation Report for This Property
The Home Valuation Report is an in-depth analysis detailing your home's value as well as a comparison with similar homes in the area
Home Values in the Area
Average Home Value in this Area
Purchase History
| Date | Buyer | Sale Price | Title Company |
|---|---|---|---|
| Kim James B | $921,500 | Chicago Title | |
| Larsen Dane P | -- | None Available | |
| Larsen Dane P | $1,100,000 | Multiple |
Source: Public Records
Mortgage History
| Date | Status | Borrower | Loan Amount |
|---|---|---|---|
| Open | Kim James B | $691,125 | |
| Previous Owner | Larsen Dane P | $593,000 | |
| Previous Owner | Larsen Dane P | $700,000 |
Source: Public Records
Tax History Compared to Growth
Tax History
| Year | Tax Paid | Tax Assessment Tax Assessment Total Assessment is a certain percentage of the fair market value that is determined by local assessors to be the total taxable value of land and additions on the property. | Land | Improvement |
|---|---|---|---|---|
| 2024 | $21,006 | $96,000 | $28,337 | $67,663 |
| 2023 | $20,398 | $96,000 | $28,337 | $67,663 |
| 2022 | $20,398 | $96,000 | $28,337 | $67,663 |
| 2021 | $19,126 | $80,210 | $18,891 | $61,319 |
| 2020 | $18,572 | $80,210 | $18,891 | $61,319 |
| 2019 | $18,134 | $89,123 | $18,891 | $70,232 |
| 2018 | $18,942 | $86,982 | $16,529 | $70,453 |
| 2017 | $17,718 | $86,982 | $16,529 | $70,453 |
| 2016 | $16,879 | $86,982 | $16,529 | $70,453 |
| 2015 | $18,224 | $86,986 | $14,168 | $72,818 |
| 2014 | $18,131 | $86,986 | $14,168 | $72,818 |
| 2013 | $17,307 | $86,986 | $14,168 | $72,818 |
Source: Public Records
Map
Nearby Homes