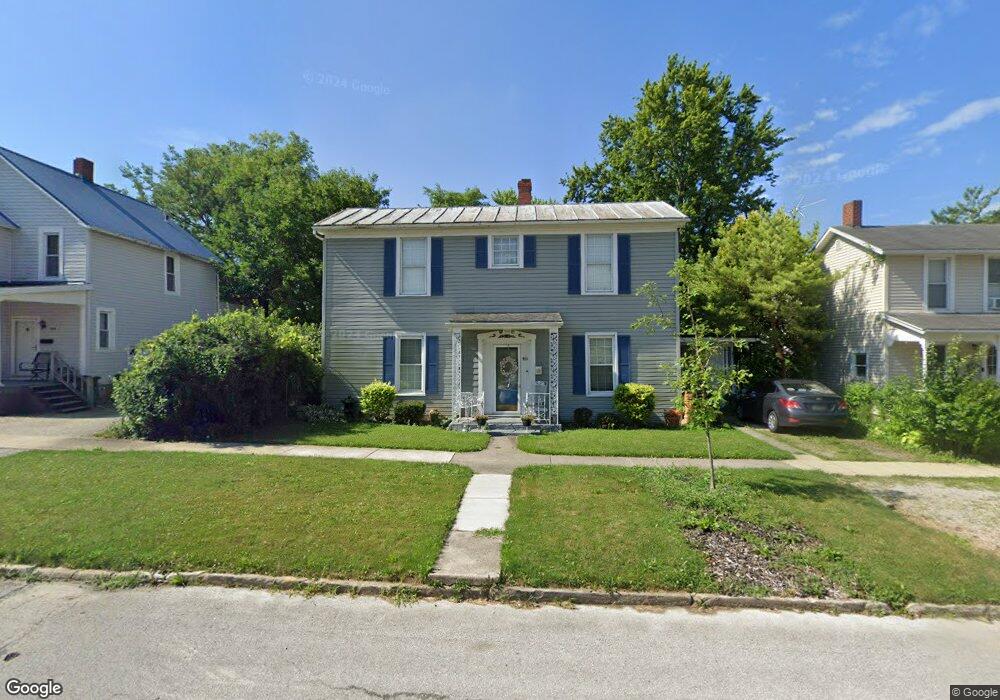
40 Liberty St Tiffin, OH 44883
Estimated Value: $141,017 - $150,000
3
Beds
1
Bath
1,664
Sq Ft
$87/Sq Ft
Est. Value
About This Home
This home is located at 40 Liberty St, Tiffin, OH 44883 and is currently estimated at $144,254, approximately $86 per square foot. 40 Liberty St is a home located in Seneca County with nearby schools including Columbian High School, Calvert High School, and Calvert Catholic Elementary School.
Ownership History
Date
Name
Owned For
Owner Type
Purchase Details
Closed on
Apr 5, 2006
Sold by
Terry Stephen P
Bought by
Terry Mary A
Current Estimated Value
Home Financials for this Owner
Home Financials are based on the most recent Mortgage that was taken out on this home.
Original Mortgage
$59,250
Interest Rate
6.48%
Mortgage Type
Future Advance Clause Open End Mortgage
Purchase Details
Closed on
May 4, 2001
Sold by
Weaver David A
Bought by
Terry Stephen P
Purchase Details
Closed on
Feb 20, 1991
Sold by
Sutter Richard L
Bought by
Weaver David A
Create a Home Valuation Report for This Property
The Home Valuation Report is an in-depth analysis detailing your home's value as well as a comparison with similar homes in the area
Home Values in the Area
Average Home Value in this Area
Purchase History
| Date | Buyer | Sale Price | Title Company |
|---|---|---|---|
| Terry Mary A | -- | None Available | |
| Terry Stephen P | $40,000 | -- | |
| Weaver David A | $27,800 | -- |
Source: Public Records
Mortgage History
| Date | Status | Borrower | Loan Amount |
|---|---|---|---|
| Closed | Terry Mary A | $59,250 |
Source: Public Records
Tax History Compared to Growth
Tax History
| Year | Tax Paid | Tax Assessment Tax Assessment Total Assessment is a certain percentage of the fair market value that is determined by local assessors to be the total taxable value of land and additions on the property. | Land | Improvement |
|---|---|---|---|---|
| 2024 | $992 | $38,580 | $3,940 | $34,640 |
| 2023 | $993 | $38,580 | $3,940 | $34,640 |
| 2022 | $1,110 | $29,690 | $3,350 | $26,340 |
| 2021 | $1,116 | $29,690 | $3,350 | $26,340 |
| 2020 | $1,133 | $29,687 | $3,346 | $26,341 |
| 2019 | $1,104 | $28,354 | $3,280 | $25,074 |
| 2018 | $1,106 | $28,354 | $3,280 | $25,074 |
| 2017 | $857 | $28,354 | $3,280 | $25,074 |
| 2016 | $1,128 | $26,440 | $3,182 | $23,258 |
| 2015 | $1,115 | $26,440 | $3,182 | $23,258 |
| 2014 | $1,700 | $26,440 | $3,182 | $23,258 |
| 2013 | $1,123 | $27,259 | $3,280 | $23,979 |
Source: Public Records
Map
Nearby Homes