Estimated Value: $270,000 - $301,000
3
Beds
2
Baths
1,289
Sq Ft
$219/Sq Ft
Est. Value
About This Home
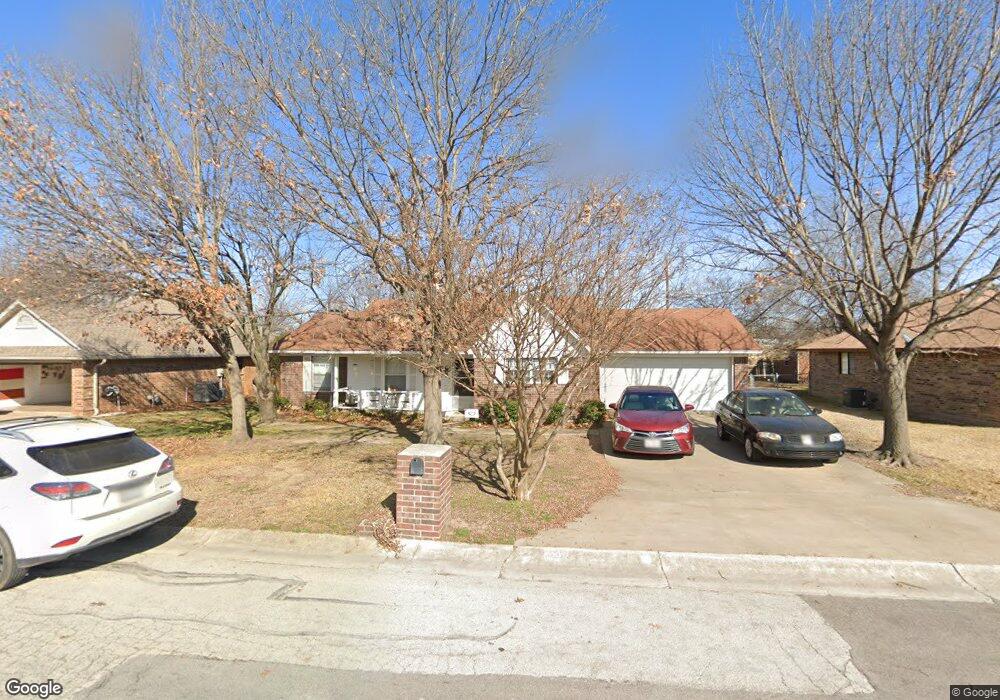
This home is located at 40 N Sharon Dr, Krum, TX 76249 and is currently estimated at $282,501, approximately $219 per square foot. 40 N Sharon Dr is a home located in Denton County with nearby schools including Krum Early Education Center, Blanche Dodd Intermediate School, and Krum Middle School.
Ownership History
Date
Name
Owned For
Owner Type
Purchase Details
Closed on
Jan 17, 2017
Sold by
Byrom Otis N and Byrom Katie D
Bought by
Hilliard Lynn
Current Estimated Value
Home Financials for this Owner
Home Financials are based on the most recent Mortgage that was taken out on this home.
Original Mortgage
$154,545
Outstanding Balance
$127,395
Interest Rate
4.13%
Mortgage Type
New Conventional
Estimated Equity
$155,106
Purchase Details
Closed on
May 23, 2013
Sold by
Coffey James Arnold
Bought by
Byrom Otis N
Home Financials for this Owner
Home Financials are based on the most recent Mortgage that was taken out on this home.
Original Mortgage
$112,244
Interest Rate
3.43%
Mortgage Type
New Conventional
Purchase Details
Closed on
Feb 25, 1997
Sold by
Shreves Eddie L and Shreves Mitra
Bought by
Coffey James A and Coffey Tammy R
Home Financials for this Owner
Home Financials are based on the most recent Mortgage that was taken out on this home.
Original Mortgage
$71,250
Interest Rate
7.92%
Create a Home Valuation Report for This Property
The Home Valuation Report is an in-depth analysis detailing your home's value as well as a comparison with similar homes in the area
Home Values in the Area
Average Home Value in this Area
Purchase History
| Date | Buyer | Sale Price | Title Company |
|---|---|---|---|
| Hilliard Lynn | -- | Lawyers Title | |
| Byrom Otis N | -- | Stc | |
| Coffey James A | -- | -- |
Source: Public Records
Mortgage History
| Date | Status | Borrower | Loan Amount |
|---|---|---|---|
| Open | Hilliard Lynn | $154,545 | |
| Previous Owner | Byrom Otis N | $112,244 | |
| Previous Owner | Coffey James A | $71,250 |
Source: Public Records
Tax History Compared to Growth
Tax History
| Year | Tax Paid | Tax Assessment Tax Assessment Total Assessment is a certain percentage of the fair market value that is determined by local assessors to be the total taxable value of land and additions on the property. | Land | Improvement |
|---|---|---|---|---|
| 2025 | $3,698 | $269,510 | $72,000 | $209,041 |
| 2024 | $4,937 | $245,009 | $0 | $0 |
| 2023 | $3,256 | $222,735 | $72,000 | $212,446 |
| 2022 | $4,645 | $202,486 | $58,500 | $184,256 |
| 2021 | $4,082 | $184,078 | $36,000 | $148,078 |
| 2020 | $4,037 | $178,272 | $36,000 | $142,272 |
| 2019 | $4,259 | $176,516 | $36,000 | $143,967 |
| 2018 | $3,892 | $160,469 | $36,000 | $124,469 |
| 2017 | $3,296 | $135,300 | $29,250 | $119,706 |
| 2016 | $2,996 | $123,000 | $29,250 | $93,750 |
| 2015 | $2,562 | $114,018 | $29,250 | $84,768 |
| 2013 | -- | $99,583 | $29,250 | $70,333 |
Source: Public Records
Map
Nearby Homes