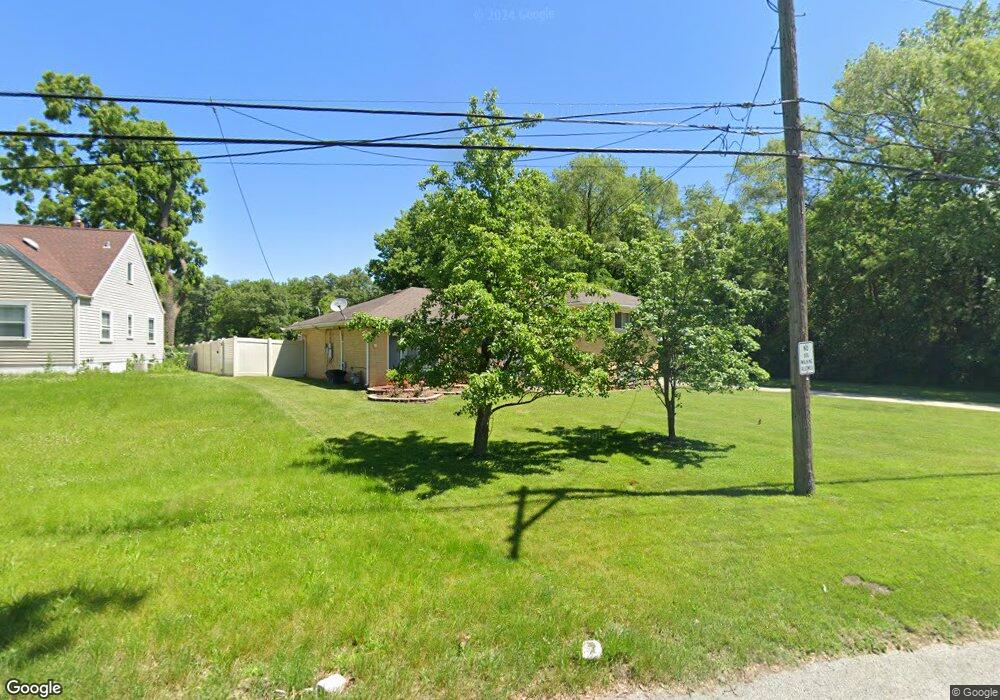
40 Schrum Rd Calumet City, IL 60409
Estimated Value: $130,000 - $174,000
2
Beds
2
Baths
959
Sq Ft
$162/Sq Ft
Est. Value
About This Home
This home is located at 40 Schrum Rd, Calumet City, IL 60409 and is currently estimated at $155,648, approximately $162 per square foot. 40 Schrum Rd is a home located in Cook County with nearby schools including Hoover Elementary School, Schrum Memorial Middle School, and Thornton Fractional North High School.
Ownership History
Date
Name
Owned For
Owner Type
Purchase Details
Closed on
Nov 1, 2022
Sold by
Covington Jennifer M
Bought by
Jennifer M Covington Trust and Covington
Current Estimated Value
Purchase Details
Closed on
Jun 22, 2006
Sold by
Lazzaroni Bobby G and Lazzaroni Mary E
Bought by
Covington Jennifer M
Home Financials for this Owner
Home Financials are based on the most recent Mortgage that was taken out on this home.
Original Mortgage
$164,000
Interest Rate
6.72%
Mortgage Type
New Conventional
Purchase Details
Closed on
Jan 18, 1996
Sold by
Johnson Barbara J
Bought by
Lazzaroni Bobby G and Lazzaroni Mary E
Home Financials for this Owner
Home Financials are based on the most recent Mortgage that was taken out on this home.
Original Mortgage
$108,000
Interest Rate
7.19%
Purchase Details
Closed on
Sep 13, 1995
Sold by
Johnson Thomas R
Bought by
Johnson Barbara J
Create a Home Valuation Report for This Property
The Home Valuation Report is an in-depth analysis detailing your home's value as well as a comparison with similar homes in the area
Home Values in the Area
Average Home Value in this Area
Purchase History
| Date | Buyer | Sale Price | Title Company |
|---|---|---|---|
| Jennifer M Covington Trust | -- | None Listed On Document | |
| Covington Jennifer M | $205,000 | Attorneys Title Guaranty Fun | |
| Lazzaroni Bobby G | $128,000 | Attorneys Title Guaranty Fun | |
| Johnson Barbara J | -- | -- |
Source: Public Records
Mortgage History
| Date | Status | Borrower | Loan Amount |
|---|---|---|---|
| Previous Owner | Covington Jennifer M | $164,000 | |
| Previous Owner | Lazzaroni Bobby G | $108,000 |
Source: Public Records
Tax History Compared to Growth
Tax History
| Year | Tax Paid | Tax Assessment Tax Assessment Total Assessment is a certain percentage of the fair market value that is determined by local assessors to be the total taxable value of land and additions on the property. | Land | Improvement |
|---|---|---|---|---|
| 2024 | $5,711 | $12,000 | $4,408 | $7,592 |
| 2023 | $3,281 | $12,000 | $4,408 | $7,592 |
| 2022 | $3,281 | $7,268 | $3,889 | $3,379 |
| 2021 | $3,295 | $7,268 | $3,889 | $3,379 |
| 2020 | $2,944 | $7,268 | $3,889 | $3,379 |
| 2019 | $3,257 | $7,810 | $3,629 | $4,181 |
| 2018 | $3,273 | $7,810 | $3,629 | $4,181 |
| 2017 | $3,151 | $7,810 | $3,629 | $4,181 |
| 2016 | $2,954 | $6,880 | $3,370 | $3,510 |
| 2015 | $2,826 | $6,880 | $3,370 | $3,510 |
| 2014 | $2,753 | $6,880 | $3,370 | $3,510 |
| 2013 | $3,221 | $8,083 | $3,370 | $4,713 |
Source: Public Records
Map
Nearby Homes
- 1374 Kenilworth Dr
- 107 163rd St
- 1404 Wentworth Ave Unit 1
- 43 163rd St
- 1375 Forest Place
- 1420 Wentworth Ave
- 1373 Stanley Blvd
- 1395 Freeland Ave
- 1304 Freeland Ave
- 1461 Wentworth Ave
- 1464 Shirley Dr
- 1341 Gordon Ave
- 1313 Gordon Ave
- 1351 Gordon Ave
- 1473 Wentworth Ave
- 100 Michigan City Rd
- 16 164th Place
- 6245 Moraine Ave
- 302 161st St
- 63 Kenwood St
- 44 Schrum Rd
- 47 Schrum Rd
- 46 Schrum Rd
- 48 Schrum Rd
- 1345 Wentworth Ave
- 1345 Wentworth Ave
- 1350 Kenilworth Dr
- 1350 Kenilworth Dr
- 1351 Kenilworth Dr
- 1351 Kenilworth Dr
- 49 Schrum Rd
- 1355 Kenilworth Dr
- 1351 Wentworth Ave
- 1351 Wentworth Ave
- 1358 Kenilworth Dr
- 1359 Kenilworth Dr
- 1355 Wentworth Ave
- 1362 Kenilworth Dr
- 1359 Wentworth Ave