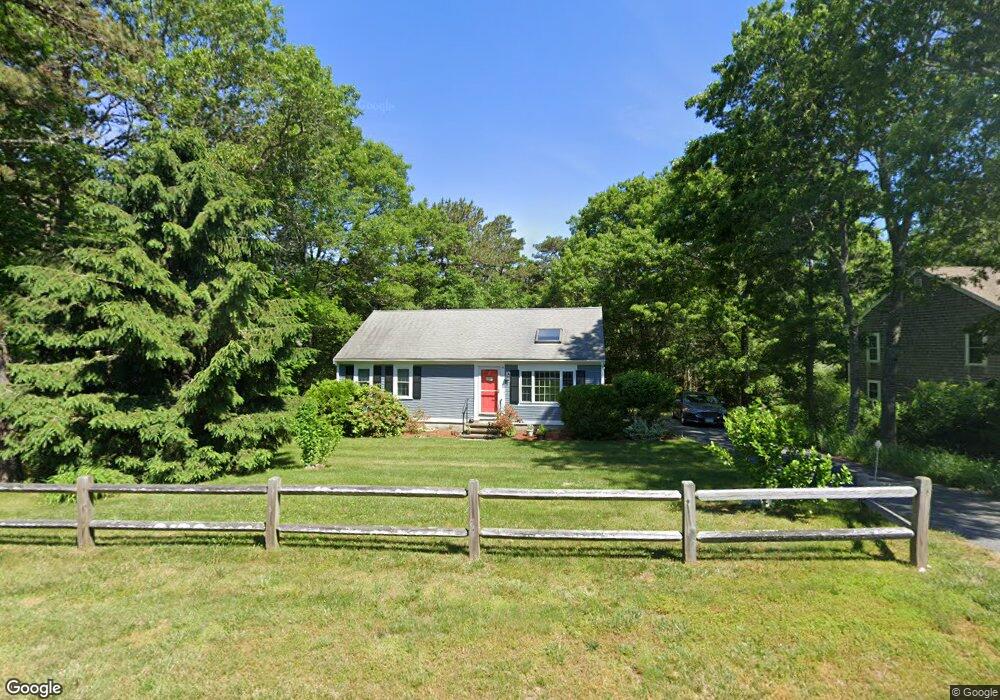
40 Sconset Cir Sandwich, MA 02563
Estimated Value: $487,000 - $609,000
2
Beds
2
Baths
988
Sq Ft
$562/Sq Ft
Est. Value
About This Home
This home is located at 40 Sconset Cir, Sandwich, MA 02563 and is currently estimated at $555,617, approximately $562 per square foot. 40 Sconset Cir is a home located in Barnstable County with nearby schools including Sandwich Middle High School and Sandwich Montessori School.
Ownership History
Date
Name
Owned For
Owner Type
Purchase Details
Closed on
Dec 30, 2015
Sold by
Est Carroll Joseph P and Carroll Joseph P
Bought by
Margaret Ann Carroll T and Carroll Joseph P
Current Estimated Value
Purchase Details
Closed on
Jun 18, 2014
Sold by
Carroll Margaret and Carroll Margaret A
Bought by
Carroll Ft and Carroll Margaret A
Purchase Details
Closed on
Nov 3, 2011
Sold by
Carroll Joseph P and Carroll Margaret
Bought by
Carroll Margaret
Purchase Details
Closed on
Nov 6, 2001
Sold by
Archambeault Leo and Archambeault Barbara
Bought by
Carroll Joseph and Carroll Margaret
Purchase Details
Closed on
Aug 21, 1992
Sold by
Greenbrier Homes Inc
Bought by
Bennett Paul H and Bennett Grace E
Home Financials for this Owner
Home Financials are based on the most recent Mortgage that was taken out on this home.
Original Mortgage
$70,000
Interest Rate
8.12%
Mortgage Type
Purchase Money Mortgage
Create a Home Valuation Report for This Property
The Home Valuation Report is an in-depth analysis detailing your home's value as well as a comparison with similar homes in the area
Home Values in the Area
Average Home Value in this Area
Purchase History
| Date | Buyer | Sale Price | Title Company |
|---|---|---|---|
| Margaret Ann Carroll T | -- | -- | |
| Est Carroll Joseph P | -- | -- | |
| Carroll Ft | -- | -- | |
| Carroll Margaret | -- | -- | |
| Carroll Joseph | $185,000 | -- | |
| Bennett Paul H | $92,900 | -- |
Source: Public Records
Mortgage History
| Date | Status | Borrower | Loan Amount |
|---|---|---|---|
| Previous Owner | Bennett Paul H | $94,500 | |
| Previous Owner | Bennett Paul H | $70,000 |
Source: Public Records
Tax History Compared to Growth
Tax History
| Year | Tax Paid | Tax Assessment Tax Assessment Total Assessment is a certain percentage of the fair market value that is determined by local assessors to be the total taxable value of land and additions on the property. | Land | Improvement |
|---|---|---|---|---|
| 2025 | $4,390 | $415,300 | $175,700 | $239,600 |
| 2024 | $4,135 | $382,900 | $156,900 | $226,000 |
| 2023 | $4,034 | $350,800 | $142,600 | $208,200 |
| 2022 | $3,940 | $299,400 | $127,300 | $172,100 |
| 2021 | $3,791 | $275,300 | $122,400 | $152,900 |
| 2020 | $3,788 | $264,700 | $119,600 | $145,100 |
| 2019 | $3,405 | $237,800 | $102,100 | $135,700 |
| 2018 | $3,215 | $225,000 | $98,600 | $126,400 |
| 2017 | $3,186 | $213,400 | $95,400 | $118,000 |
| 2016 | $3,050 | $210,800 | $94,400 | $116,400 |
| 2015 | $2,952 | $199,200 | $85,100 | $114,100 |
Source: Public Records
Map
Nearby Homes
- 22 Sconset Cir
- 84 Harlow Rd
- 59 Southpoint Dr Unit 59
- 96 Pimlico Pond Rd
- 6 Southfield Ln
- 58 Southpoint Dr Unit J
- 93 Deerfield Rd
- 544 Cotuit Rd
- 5 Aviators Ln
- 3 Glenwood Ln
- 6 Santuit Pond Rd
- 19 Oriole Ln
- 185 Cotuit Rd Unit BE4
- 185 Cotuit Rd Unit JP1
- 185 Cotuit Rd Unit C5 Aspen
- 18 Katian Way
- 68 Fox Hill Rd
- 22 Candlewood Ln