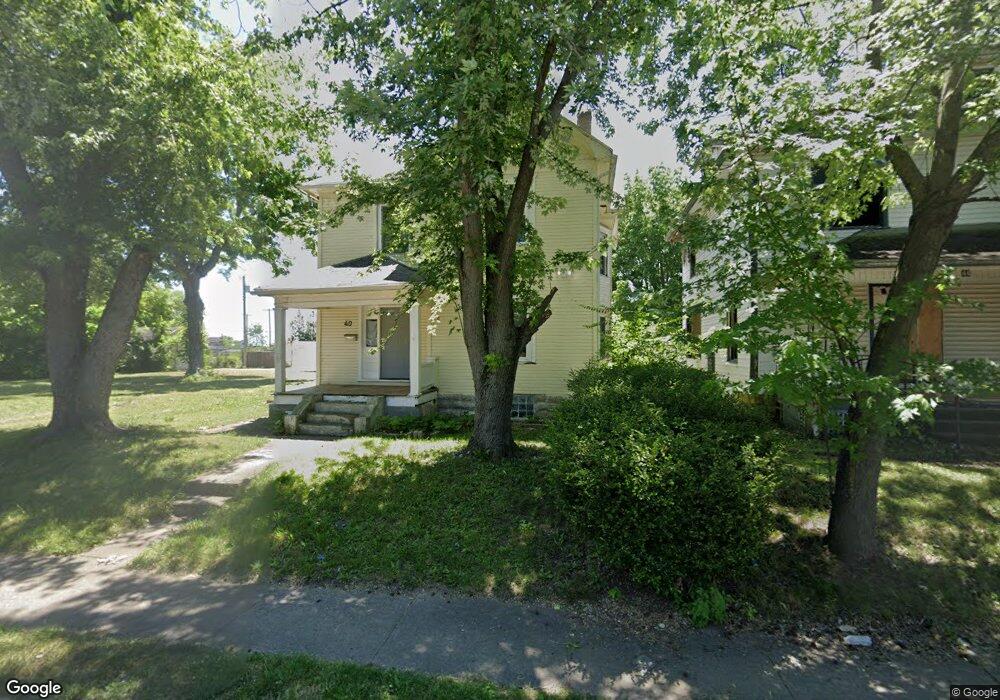
40 Victor Ave Dayton, OH 45405
Santa Clara NeighborhoodEstimated Value: $56,584 - $96,000
4
Beds
1
Bath
2,192
Sq Ft
$36/Sq Ft
Est. Value
About This Home
This home is located at 40 Victor Ave, Dayton, OH 45405 and is currently estimated at $79,396, approximately $36 per square foot. 40 Victor Ave is a home located in Montgomery County with nearby schools including Valerie Elementary School, Deca Prep, and Dayton Leadership Academies.
Ownership History
Date
Name
Owned For
Owner Type
Purchase Details
Closed on
Apr 12, 2023
Sold by
Streck Rob
Bought by
Ang Midwest Llc
Current Estimated Value
Purchase Details
Closed on
Jul 20, 2018
Sold by
Davenport Ii Andre
Bought by
Anderson Antanesha
Purchase Details
Closed on
Feb 6, 2018
Sold by
Davenport De Angelo and Davenport De Angelo
Bought by
Davenport Ii Andre
Purchase Details
Closed on
Jan 8, 2018
Sold by
Davenport Lenee
Bought by
Davenport De Angelo
Purchase Details
Closed on
Oct 28, 2013
Sold by
Eh Pooled 412 Lp
Bought by
Arline Ruby Manuel
Purchase Details
Closed on
May 31, 2012
Sold by
Harbour Portfolio Vi Lp
Bought by
Eh Pooled 412 Lp
Purchase Details
Closed on
May 26, 2011
Sold by
Fannie Mae
Bought by
Harbour Portfolio Vi Lp
Purchase Details
Closed on
Feb 15, 2011
Sold by
Barrows Chad E
Bought by
Federal National Mortgage Association
Create a Home Valuation Report for This Property
The Home Valuation Report is an in-depth analysis detailing your home's value as well as a comparison with similar homes in the area
Home Values in the Area
Average Home Value in this Area
Purchase History
| Date | Buyer | Sale Price | Title Company |
|---|---|---|---|
| Ang Midwest Llc | $25,483 | None Listed On Document | |
| Anderson Antanesha | $38,000 | None Available | |
| Davenport Ii Andre | -- | None Available | |
| Davenport De Angelo | -- | None Available | |
| Arline Ruby Manuel | $1,350 | None Available | |
| Eh Pooled 412 Lp | $2,640 | None Available | |
| Harbour Portfolio Vi Lp | $5,418 | Attorney | |
| Federal National Mortgage Association | $6,000 | None Available |
Source: Public Records
Tax History Compared to Growth
Tax History
| Year | Tax Paid | Tax Assessment Tax Assessment Total Assessment is a certain percentage of the fair market value that is determined by local assessors to be the total taxable value of land and additions on the property. | Land | Improvement |
|---|---|---|---|---|
| 2024 | $330 | $5,930 | $3,350 | $2,580 |
| 2023 | $330 | $5,930 | $3,350 | $2,580 |
| 2022 | $682 | $5,070 | $2,860 | $2,210 |
| 2021 | $363 | $5,070 | $2,860 | $2,210 |
| 2020 | $438 | $5,070 | $2,860 | $2,210 |
| 2019 | $1,078 | $13,300 | $2,290 | $11,010 |
| 2018 | $1,181 | $13,300 | $2,290 | $11,010 |
| 2017 | $1,572 | $13,300 | $2,290 | $11,010 |
| 2016 | $1,430 | $13,770 | $2,860 | $10,910 |
| 2015 | $1,602 | $13,770 | $2,860 | $10,910 |
| 2014 | $1,602 | $13,770 | $2,860 | $10,910 |
| 2012 | -- | $15,670 | $3,570 | $12,100 |
Source: Public Records
Map
Nearby Homes
- 21 Niagara Ave Unit 19
- 27 Santa Clara Ave
- 123 Delaware Ave
- 124 Niagara Ave
- 15 Ridge Ave
- 136 Niagara Ave
- 137 & 139 Victor Ave Unit 137 & 139
- 147 Niagara Ave
- 144 Victor Ave
- 2 E Hudson Ave
- 152 Victor Ave
- 105 Elmwood Ave E
- 202 Santa Clara Ave
- 205 Victor Ave
- 27 E Hudson Ave
- 1314 Wheatley Ave
- 98 W Hudson Ave Unit 96
- 89 W Hudson Ave Unit 87
- 372 Kenilworth Ave
- 403 Delaware Ave