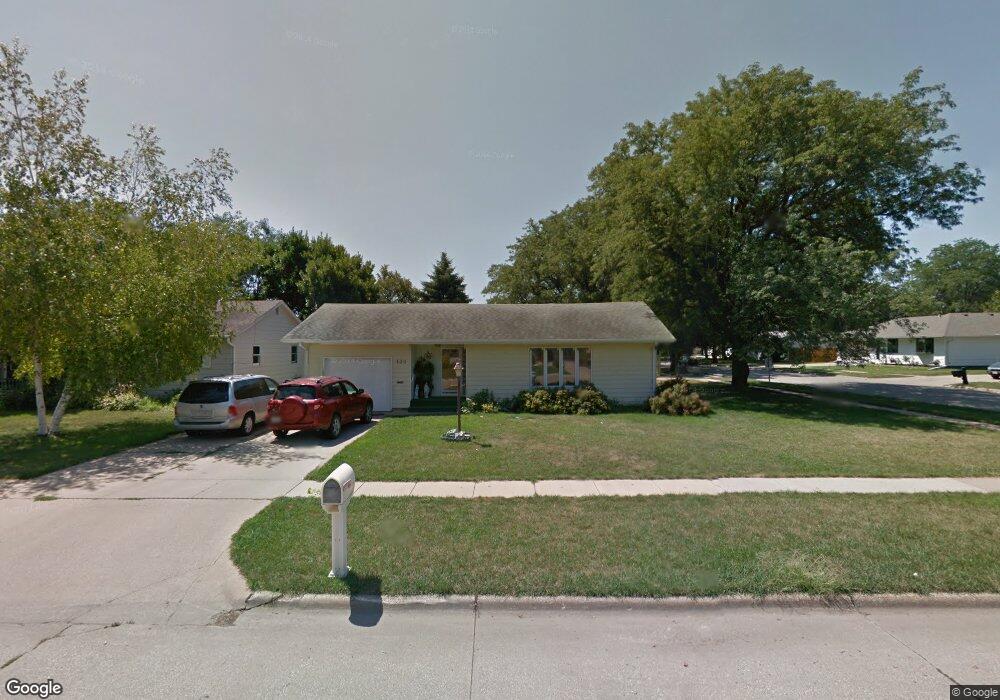
400 E 32nd St South Sioux City, NE 68776
Estimated Value: $239,880 - $261,000
3
Beds
1
Bath
1,354
Sq Ft
$183/Sq Ft
Est. Value
About This Home
This home is located at 400 E 32nd St, South Sioux City, NE 68776 and is currently estimated at $247,470, approximately $182 per square foot. 400 E 32nd St is a home located in Dakota County with nearby schools including Cardinal Elementary School, South Sioux City Middle School, and South Sioux Senior High School.
Ownership History
Date
Name
Owned For
Owner Type
Purchase Details
Closed on
Feb 22, 2024
Sold by
Vaca Desalcido Alma Delia
Bought by
Gonzalez Moises A and Gonzalez Blanca A
Current Estimated Value
Home Financials for this Owner
Home Financials are based on the most recent Mortgage that was taken out on this home.
Original Mortgage
$180,000
Outstanding Balance
$176,956
Interest Rate
7.13%
Mortgage Type
New Conventional
Estimated Equity
$70,514
Purchase Details
Closed on
Jan 2, 2005
Sold by
Burmester Alda A and The Alda A Burmester Trust
Bought by
Salcido Salvador and Vaca De Salcido Alma Delia
Home Financials for this Owner
Home Financials are based on the most recent Mortgage that was taken out on this home.
Original Mortgage
$88,000
Interest Rate
6.06%
Mortgage Type
Adjustable Rate Mortgage/ARM
Create a Home Valuation Report for This Property
The Home Valuation Report is an in-depth analysis detailing your home's value as well as a comparison with similar homes in the area
Home Values in the Area
Average Home Value in this Area
Purchase History
| Date | Buyer | Sale Price | Title Company |
|---|---|---|---|
| Gonzalez Moises A | $225,000 | Lewis & Clark Title | |
| Salcido Salvador | $85,555 | -- |
Source: Public Records
Mortgage History
| Date | Status | Borrower | Loan Amount |
|---|---|---|---|
| Open | Gonzalez Moises A | $180,000 | |
| Previous Owner | Salcido Salvador | $88,000 |
Source: Public Records
Tax History Compared to Growth
Tax History
| Year | Tax Paid | Tax Assessment Tax Assessment Total Assessment is a certain percentage of the fair market value that is determined by local assessors to be the total taxable value of land and additions on the property. | Land | Improvement |
|---|---|---|---|---|
| 2024 | $2,438 | $186,305 | $21,435 | $164,870 |
| 2023 | $2,920 | $164,415 | $18,200 | $146,215 |
| 2022 | $2,937 | $153,595 | $18,200 | $135,395 |
| 2021 | $2,800 | $141,285 | $18,200 | $123,085 |
| 2020 | $2,777 | $138,895 | $18,200 | $120,695 |
| 2019 | $2,612 | $130,275 | $18,200 | $112,075 |
| 2018 | $2,613 | $129,240 | $19,360 | $109,880 |
| 2017 | $2,286 | $113,360 | $19,360 | $94,000 |
| 2016 | $1,747 | $88,120 | $19,360 | $68,760 |
| 2014 | $2,204 | $107,060 | $20,400 | $86,660 |
Source: Public Records
Map
Nearby Homes