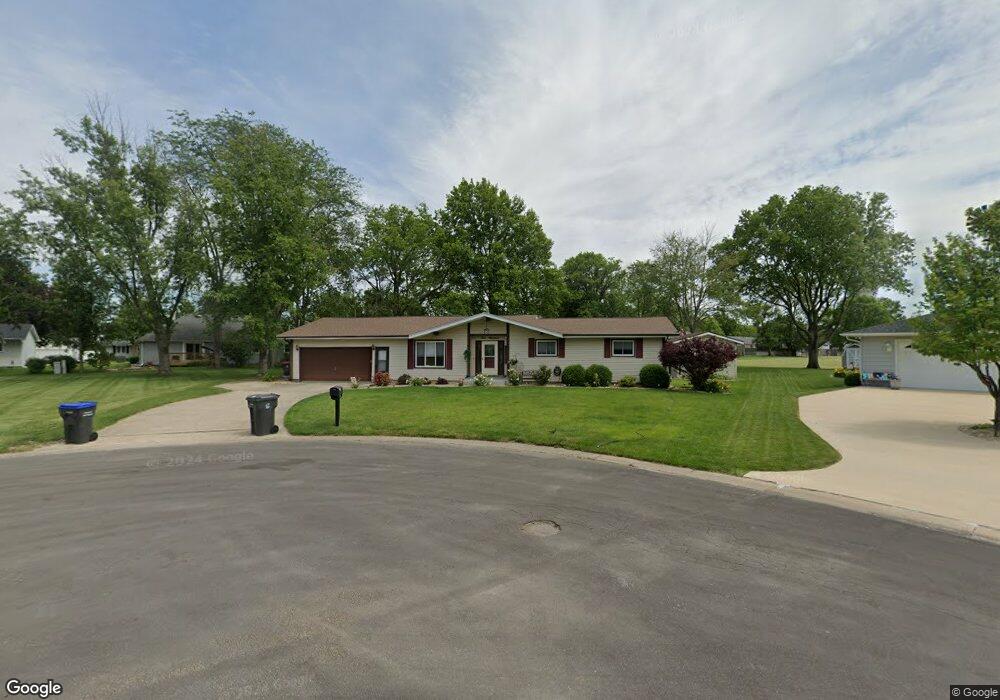
400 Kirk Dr Mount Zion, IL 62549
Estimated Value: $187,000 - $355,000
3
Beds
2
Baths
2,031
Sq Ft
$119/Sq Ft
Est. Value
About This Home
This home is located at 400 Kirk Dr, Mount Zion, IL 62549 and is currently estimated at $242,497, approximately $119 per square foot. 400 Kirk Dr is a home located in Macon County with nearby schools including McGaughey Elementary School, Mt. Zion Intermediate School, and Mt. Zion Elementary School.
Ownership History
Date
Name
Owned For
Owner Type
Purchase Details
Closed on
May 10, 2012
Sold by
Reyner Holly and Ackerman Dawn
Bought by
Wulsch Daniel L and Wulsch Lynn M
Current Estimated Value
Home Financials for this Owner
Home Financials are based on the most recent Mortgage that was taken out on this home.
Original Mortgage
$130,158
Outstanding Balance
$90,602
Interest Rate
4%
Mortgage Type
VA
Estimated Equity
$151,895
Purchase Details
Closed on
Feb 12, 2010
Sold by
Gruen Gary L and Gruen Paula K
Bought by
Reyner Holly and Ackerman Dawn
Home Financials for this Owner
Home Financials are based on the most recent Mortgage that was taken out on this home.
Original Mortgage
$140,409
Interest Rate
5.25%
Mortgage Type
FHA
Purchase Details
Closed on
Jun 1, 2004
Create a Home Valuation Report for This Property
The Home Valuation Report is an in-depth analysis detailing your home's value as well as a comparison with similar homes in the area
Home Values in the Area
Average Home Value in this Area
Purchase History
| Date | Buyer | Sale Price | Title Company |
|---|---|---|---|
| Wulsch Daniel L | $145,000 | None Available | |
| Reyner Holly | $143,000 | None Available | |
| -- | $121,000 | -- |
Source: Public Records
Mortgage History
| Date | Status | Borrower | Loan Amount |
|---|---|---|---|
| Open | Wulsch Daniel L | $130,158 | |
| Previous Owner | Reyner Holly | $140,409 |
Source: Public Records
Tax History Compared to Growth
Tax History
| Year | Tax Paid | Tax Assessment Tax Assessment Total Assessment is a certain percentage of the fair market value that is determined by local assessors to be the total taxable value of land and additions on the property. | Land | Improvement |
|---|---|---|---|---|
| 2024 | $3,879 | $55,692 | $6,050 | $49,642 |
| 2023 | $3,740 | $51,797 | $5,627 | $46,170 |
| 2022 | $3,569 | $49,130 | $5,338 | $43,792 |
| 2021 | $3,453 | $46,026 | $5,000 | $41,026 |
| 2020 | $3,515 | $47,220 | $5,388 | $41,832 |
| 2019 | $3,515 | $47,220 | $5,388 | $41,832 |
| 2018 | $3,404 | $46,014 | $5,250 | $40,764 |
| 2017 | $3,354 | $45,129 | $5,149 | $39,980 |
| 2016 | $3,318 | $44,344 | $5,059 | $39,285 |
| 2015 | $3,207 | $43,905 | $5,009 | $38,896 |
| 2014 | $3,092 | $43,905 | $5,009 | $38,896 |
| 2013 | $3,128 | $43,905 | $5,009 | $38,896 |
Source: Public Records
Map
Nearby Homes
- 125 W Walnut St
- 524 Elm St
- 355 S Henderson St
- 1420 Noble Dr
- 1440 N Alexander Dr
- 265 Carrington Ave
- 5909 Camp Warren Rd
- 6680 John Dr
- 6686 John Dr
- 1625 Ridgewood Ct
- Lot 32 Janine Way
- Lot 3 Fletcher Ln
- Lot 1 Fletcher Ln
- Lot 2 Fletcher Ln
- 3930 S Mount Zion Rd
- 1700 Brentwood Dr
- 695 Country Ct
- 1030 Country Manor
- 860 W Wildwood Dr
- 1610 Robin Ct
- 311 Rolling Green Dr
- 321 Rolling Green Dr
- 410 Kirk Dr
- 345 May Ct
- 301 Rolling Green Dr
- 331 Rolling Green Dr
- 241 Rolling Green Dr
- 340 May Ct
- 420 Kirk Dr
- 322 Rolling Green Dr
- 312 Rolling Green Dr
- 332 Rolling Green Dr
- 231 Rolling Green Dr
- 335 May Ct
- 302 Rolling Green Dr
- 344 Rolling Green Dr
- 330 May Ct
- 425 Kirk Dr
- 242 Rolling Green Dr
- 405 McGaughey Dr