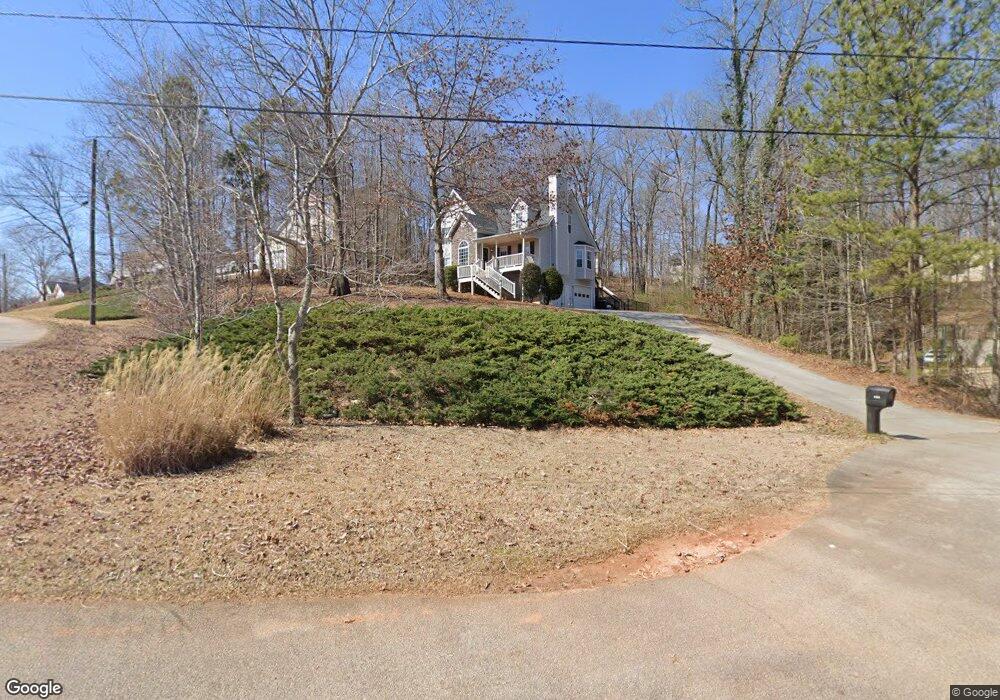
400 Tracy Ct Villa Rica, GA 30180
Estimated Value: $302,157 - $355,000
3
Beds
2
Baths
1,904
Sq Ft
$172/Sq Ft
Est. Value
About This Home
This home is located at 400 Tracy Ct, Villa Rica, GA 30180 and is currently estimated at $327,789, approximately $172 per square foot. 400 Tracy Ct is a home located in Carroll County with nearby schools including Glanton-Hindsman Elementary School, Villa Rica Middle School, and Villa Rica High School.
Ownership History
Date
Name
Owned For
Owner Type
Purchase Details
Closed on
Aug 25, 2005
Sold by
Henry David R
Bought by
Darby Alexander and Darby Ashley
Current Estimated Value
Home Financials for this Owner
Home Financials are based on the most recent Mortgage that was taken out on this home.
Original Mortgage
$144,850
Outstanding Balance
$76,812
Interest Rate
5.71%
Mortgage Type
New Conventional
Estimated Equity
$250,977
Purchase Details
Closed on
Sep 17, 2000
Sold by
Toone Keith
Bought by
Toone Keith J
Purchase Details
Closed on
Apr 21, 2000
Sold by
Gentry Homes & Dev I
Bought by
Henry David R and Henry Kris
Purchase Details
Closed on
Jan 25, 2000
Sold by
Toone Keith J
Bought by
Gentry Homes & Dev I
Purchase Details
Closed on
Sep 17, 1999
Sold by
Phillips Bobby E
Bought by
Toone Keith
Purchase Details
Closed on
May 24, 1999
Sold by
Amidon Perry E and Amidon Bon
Bought by
Phillips Bobby E
Create a Home Valuation Report for This Property
The Home Valuation Report is an in-depth analysis detailing your home's value as well as a comparison with similar homes in the area
Home Values in the Area
Average Home Value in this Area
Purchase History
| Date | Buyer | Sale Price | Title Company |
|---|---|---|---|
| Darby Alexander | $144,850 | -- | |
| Toone Keith J | -- | -- | |
| Henry David R | $129,700 | -- | |
| Gentry Homes & Dev I | $21,600 | -- | |
| Toone Keith | $16,500 | -- | |
| Phillips Bobby E | $137,300 | -- |
Source: Public Records
Mortgage History
| Date | Status | Borrower | Loan Amount |
|---|---|---|---|
| Open | Darby Alexander | $144,850 |
Source: Public Records
Tax History Compared to Growth
Tax History
| Year | Tax Paid | Tax Assessment Tax Assessment Total Assessment is a certain percentage of the fair market value that is determined by local assessors to be the total taxable value of land and additions on the property. | Land | Improvement |
|---|---|---|---|---|
| 2024 | $2,320 | $129,958 | $12,000 | $117,958 |
| 2023 | $2,320 | $119,712 | $12,000 | $107,712 |
| 2022 | $2,055 | $102,928 | $12,000 | $90,928 |
| 2021 | $1,851 | $88,723 | $11,000 | $77,723 |
| 2020 | $1,702 | $80,340 | $11,000 | $69,340 |
| 2019 | $1,605 | $74,466 | $11,000 | $63,466 |
| 2018 | $1,449 | $64,920 | $11,000 | $53,920 |
| 2017 | $1,453 | $64,920 | $11,000 | $53,920 |
| 2016 | $1,453 | $64,920 | $11,000 | $53,920 |
| 2015 | $1,195 | $46,736 | $8,400 | $38,337 |
| 2014 | $988 | $39,180 | $8,400 | $30,780 |
Source: Public Records
Map
Nearby Homes
- 220 Bonnie Sue Dr
- 404 Tracy Ct
- 216 Bonnie Sue Dr
- 499 Ledbetter Rd
- 499 Ledbetter Rd Unit 91
- 517 Ledbetter Rd Unit 92
- 401 Tracy Ct
- 217 Bonnie Sue Dr
- 493 Ledbetter Rd
- 239 Bonnie Sue Dr
- 405 Tracy Ct
- 523 Ledbetter Rd
- 212 Bonnie Sue Dr
- 236 Bonnie Sue Dr
- 487 Ledbetter Rd
- 529 Ledbetter Rd
- 326 Indian Lake Trail
- 344 Indian Lake Trail
- 342 Indian Lake Trail
- 346 Indian Lake Trail