Estimated Value: $471,000 - $682,745
3
Beds
2
Baths
1,600
Sq Ft
$361/Sq Ft
Est. Value
About This Home
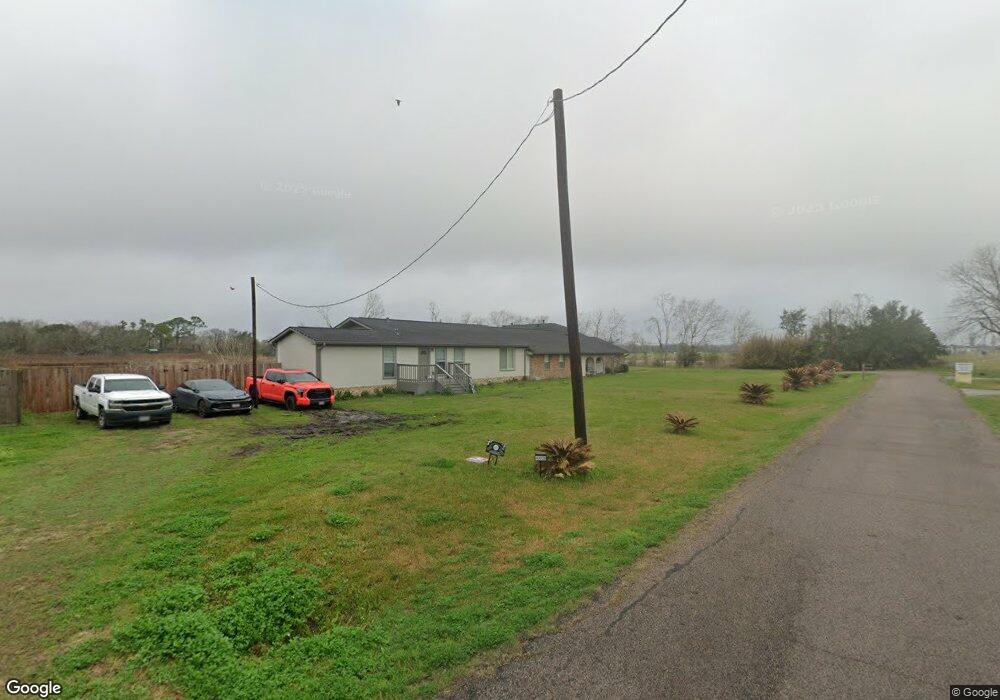
This home is located at 4000 County Road 833 Unit B, Alvin, TX 77511 and is currently estimated at $576,873, approximately $360 per square foot. 4000 County Road 833 Unit B is a home located in Brazoria County with nearby schools including R.L. Stevenson Primary School, Alvin Junior High School, and Alvin High School.
Ownership History
Date
Name
Owned For
Owner Type
Purchase Details
Closed on
Mar 19, 2021
Sold by
Griffith Richard Allen and Estate Of John Logan Clarke
Bought by
Hunt Jamie
Current Estimated Value
Purchase Details
Closed on
Dec 29, 2010
Sold by
Mauk Michael D and Cushman Susan J
Bought by
Clarke John Logan and Reed Frank Delbert
Home Financials for this Owner
Home Financials are based on the most recent Mortgage that was taken out on this home.
Original Mortgage
$192,000
Interest Rate
4.36%
Mortgage Type
New Conventional
Purchase Details
Closed on
Aug 25, 2000
Sold by
Green Gordon and Green Debbie
Bought by
Mauk Michael D and Cushman Susan J
Home Financials for this Owner
Home Financials are based on the most recent Mortgage that was taken out on this home.
Original Mortgage
$157,600
Interest Rate
8.15%
Create a Home Valuation Report for This Property
The Home Valuation Report is an in-depth analysis detailing your home's value as well as a comparison with similar homes in the area
Home Values in the Area
Average Home Value in this Area
Purchase History
| Date | Buyer | Sale Price | Title Company |
|---|---|---|---|
| Hunt Jamie | -- | Capital Title | |
| Clarke John Logan | -- | None Available | |
| Mauk Michael D | -- | -- |
Source: Public Records
Mortgage History
| Date | Status | Borrower | Loan Amount |
|---|---|---|---|
| Previous Owner | Clarke John Logan | $192,000 | |
| Previous Owner | Mauk Michael D | $157,600 | |
| Closed | Mauk Michael D | $29,550 |
Source: Public Records
Tax History Compared to Growth
Tax History
| Year | Tax Paid | Tax Assessment Tax Assessment Total Assessment is a certain percentage of the fair market value that is determined by local assessors to be the total taxable value of land and additions on the property. | Land | Improvement |
|---|---|---|---|---|
| 2025 | $8,626 | $665,000 | $275,000 | $390,000 |
| 2023 | $8,626 | $489,370 | $308,180 | $181,190 |
| 2022 | $5,785 | $271,520 | $192,620 | $78,900 |
| 2021 | $2,702 | $121,750 | $62,155 | $59,595 |
| 2020 | $4,344 | $258,940 | $69,925 | $189,015 |
| 2019 | $4,065 | $217,105 | $69,925 | $147,180 |
| 2018 | $3,705 | $168,660 | $69,925 | $98,735 |
| 2017 | $3,409 | $170,095 | $69,925 | $100,170 |
| 2016 | $3,099 | $175,120 | $74,950 | $100,170 |
| 2015 | $5,016 | $239,870 | $71,690 | $168,180 |
| 2014 | $5,016 | $233,790 | $71,690 | $162,100 |
Source: Public Records
Map
Nearby Homes
- 3221 County Road 890
- 00 County Road 424
- 300 Mustang Rd
- 4113 County Road 424
- 00 Highway 6
- 1751 Rosharon Rd
- 0 W Highway 6 Unit 68293296
- 3810 Westglen Dr
- 3111 Paso Fino Dr
- 2108 County Road 740
- 1027 Paddlefish
- 3600 177
- 1025 Paddlefish
- 1814 Rymal Ranch Rd
- 369 Windsor Square
- 002 Johnston St
- 1145 Westglen Dr
- 336 Paso Fino Dr
- 3925 Larkspur St
- 610 Linda Ln
- 4000 County Road 833
- 4000 County Road 833 Unit a
- 4004 Cr 833
- 4004 County Road 833
- 4008 County Road 833
- 4101 County Road 833
- 4003 County Road 833
- 4011 County Road 833
- 4010 County Road 833
- 4107 County Road 833
- 4113 County Road 833
- 4117 County Road 833
- 4116 County Road 424
- 3121 County Road 890
- 3131 County Road 890
- 3111 County Road 890
- 3201 County Road 890
- 3107 County Road 890
- 3211 County Road 890
- 4121 County Road 833