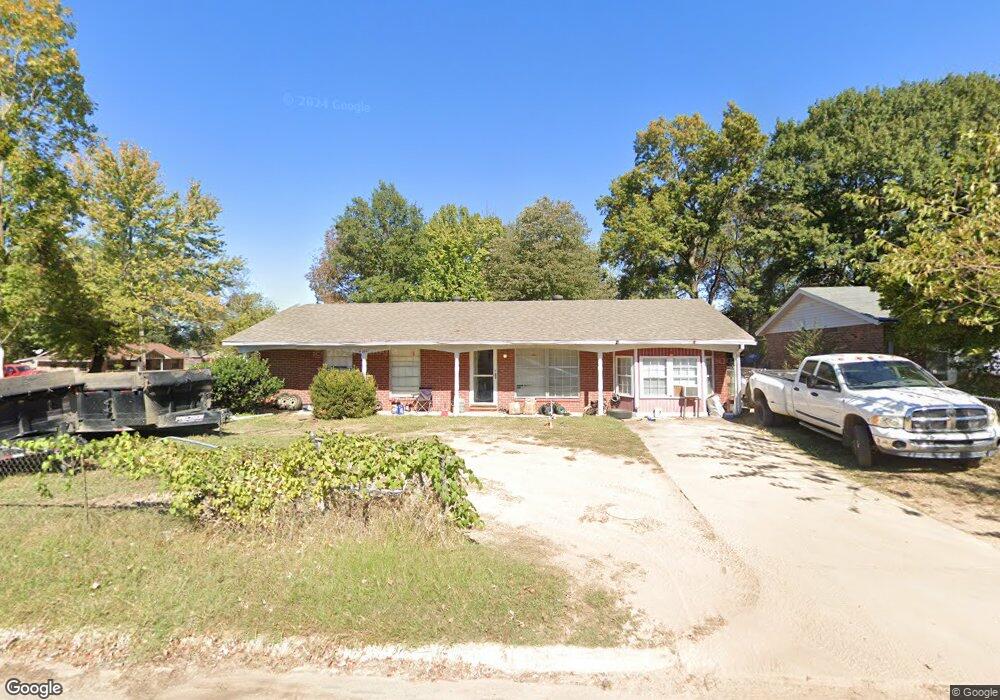
4001 Pond St van Buren, AR 72956
Estimated Value: $138,000 - $143,000
--
Bed
2
Baths
1,291
Sq Ft
$109/Sq Ft
Est. Value
About This Home
This home is located at 4001 Pond St, van Buren, AR 72956 and is currently estimated at $141,238, approximately $109 per square foot. 4001 Pond St is a home located in Crawford County with nearby schools including James R. Tate Elementary School, Butterfield Trail Middle School, and Van Buren High School.
Ownership History
Date
Name
Owned For
Owner Type
Purchase Details
Closed on
Feb 9, 2010
Sold by
Vannguyen Song Van and Le Duyen Phuong Thi
Bought by
Le Nhat Thieu and Do Hang Phuong Thi
Current Estimated Value
Purchase Details
Closed on
Mar 23, 2006
Sold by
Le Nhat Thien and Do Hang
Bought by
Vannguyen Song Van
Home Financials for this Owner
Home Financials are based on the most recent Mortgage that was taken out on this home.
Original Mortgage
$40,000
Interest Rate
6.24%
Mortgage Type
Stand Alone Second
Purchase Details
Closed on
Jan 31, 2006
Sold by
Thai Ban Thi
Bought by
Le Nhat Thien and Do Hang
Home Financials for this Owner
Home Financials are based on the most recent Mortgage that was taken out on this home.
Original Mortgage
$40,000
Interest Rate
6.24%
Mortgage Type
Stand Alone Second
Purchase Details
Closed on
Apr 28, 2000
Bought by
Hoang-Tuai
Purchase Details
Closed on
Nov 26, 1997
Bought by
Jones-Hoang
Purchase Details
Closed on
Mar 5, 1990
Bought by
Jones-Jones
Create a Home Valuation Report for This Property
The Home Valuation Report is an in-depth analysis detailing your home's value as well as a comparison with similar homes in the area
Home Values in the Area
Average Home Value in this Area
Purchase History
| Date | Buyer | Sale Price | Title Company |
|---|---|---|---|
| Le Nhat Thieu | $70,000 | -- | |
| Vannguyen Song Van | $40,000 | None Available | |
| Le Nhat Thien | $59,000 | None Available | |
| Hoang-Tuai | -- | -- | |
| Jones-Hoang | $34,000 | -- | |
| Jones-Jones | $40,000 | -- |
Source: Public Records
Mortgage History
| Date | Status | Borrower | Loan Amount |
|---|---|---|---|
| Previous Owner | Le Nhat Thien | $40,000 |
Source: Public Records
Tax History Compared to Growth
Tax History
| Year | Tax Paid | Tax Assessment Tax Assessment Total Assessment is a certain percentage of the fair market value that is determined by local assessors to be the total taxable value of land and additions on the property. | Land | Improvement |
|---|---|---|---|---|
| 2025 | $1,048 | $26,300 | $3,000 | $23,300 |
| 2024 | $968 | $26,300 | $3,000 | $23,300 |
| 2023 | $887 | $26,300 | $3,000 | $23,300 |
| 2022 | $807 | $15,540 | $2,000 | $13,540 |
| 2021 | $807 | $15,540 | $2,000 | $13,540 |
| 2020 | $807 | $15,540 | $2,000 | $13,540 |
| 2019 | $807 | $15,540 | $2,000 | $13,540 |
| 2018 | $807 | $15,540 | $2,000 | $13,540 |
| 2017 | $812 | $15,650 | $2,000 | $13,650 |
| 2016 | $812 | $15,650 | $2,000 | $13,650 |
| 2015 | $765 | $15,650 | $2,000 | $13,650 |
| 2014 | $765 | $15,650 | $2,000 | $13,650 |
Source: Public Records
Map
Nearby Homes