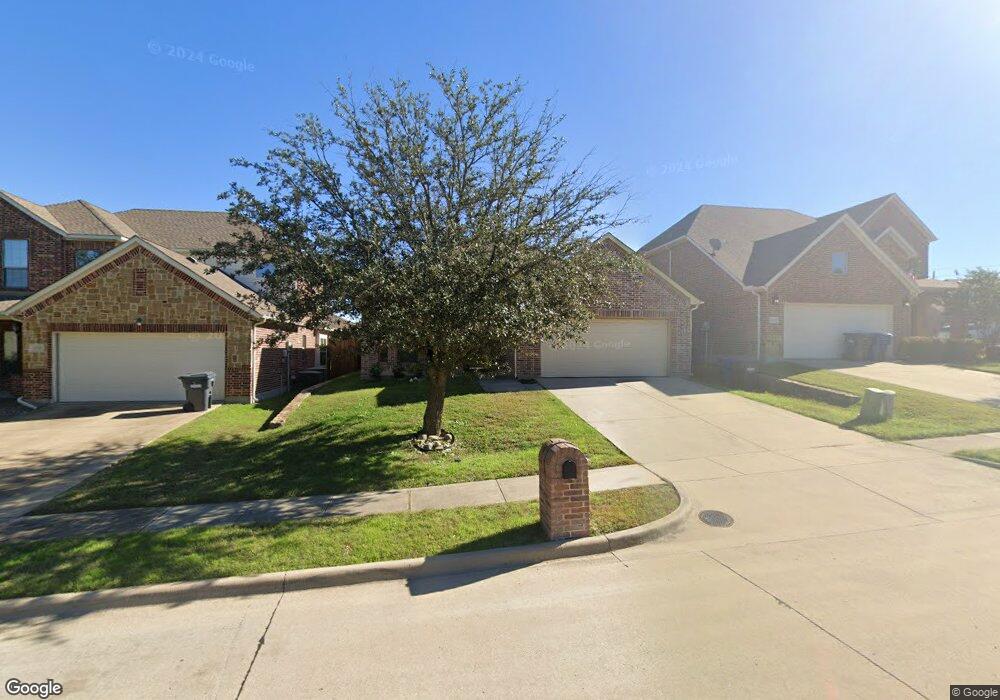
4004 Sioux Dr McKinney, TX 75071
North McKinney NeighborhoodEstimated Value: $374,096 - $408,000
3
Beds
3
Baths
1,926
Sq Ft
$204/Sq Ft
Est. Value
About This Home
This home is located at 4004 Sioux Dr, McKinney, TX 75071 and is currently estimated at $392,274, approximately $203 per square foot. 4004 Sioux Dr is a home located in Collin County with nearby schools including Naomi Press Elementary School, Scott Morgan Johnson Middle School, and Mckinney North High School.
Ownership History
Date
Name
Owned For
Owner Type
Purchase Details
Closed on
Mar 9, 2012
Sold by
Williams Preston
Bought by
Morrison Katie I and Morrison Jerry D
Current Estimated Value
Home Financials for this Owner
Home Financials are based on the most recent Mortgage that was taken out on this home.
Original Mortgage
$160,817
Outstanding Balance
$109,836
Interest Rate
3.75%
Mortgage Type
FHA
Estimated Equity
$282,438
Purchase Details
Closed on
Feb 26, 2010
Sold by
First Bank
Bought by
Williams Preston
Purchase Details
Closed on
Feb 4, 2009
Sold by
Royce Homes Dallas Lp
Bought by
First Bank
Purchase Details
Closed on
Jan 9, 2008
Sold by
Hfg Centerra Development Lp
Bought by
Royce Homes Dallas Lp
Home Financials for this Owner
Home Financials are based on the most recent Mortgage that was taken out on this home.
Original Mortgage
$20,000,000
Interest Rate
6.07%
Mortgage Type
Purchase Money Mortgage
Create a Home Valuation Report for This Property
The Home Valuation Report is an in-depth analysis detailing your home's value as well as a comparison with similar homes in the area
Home Values in the Area
Average Home Value in this Area
Purchase History
| Date | Buyer | Sale Price | Title Company |
|---|---|---|---|
| Morrison Katie I | -- | Hftc | |
| Williams Preston | -- | None Available | |
| First Bank | -- | None Available | |
| Royce Homes Dallas Lp | -- | Stnt |
Source: Public Records
Mortgage History
| Date | Status | Borrower | Loan Amount |
|---|---|---|---|
| Open | Morrison Katie I | $160,817 | |
| Previous Owner | Royce Homes Dallas Lp | $20,000,000 |
Source: Public Records
Tax History Compared to Growth
Tax History
| Year | Tax Paid | Tax Assessment Tax Assessment Total Assessment is a certain percentage of the fair market value that is determined by local assessors to be the total taxable value of land and additions on the property. | Land | Improvement |
|---|---|---|---|---|
| 2025 | $3,336 | $375,859 | $120,000 | $274,014 |
| 2024 | $3,336 | $341,690 | $120,000 | $271,839 |
| 2023 | $3,336 | $310,627 | $120,000 | $278,395 |
| 2022 | $5,659 | $282,388 | $95,000 | $270,865 |
| 2021 | $5,452 | $256,716 | $70,000 | $186,716 |
| 2020 | $5,858 | $259,206 | $55,000 | $204,206 |
| 2019 | $5,941 | $249,934 | $55,000 | $194,934 |
| 2018 | $6,182 | $254,154 | $55,000 | $199,154 |
| 2017 | $5,723 | $236,258 | $55,000 | $181,258 |
| 2016 | $5,310 | $218,932 | $55,000 | $163,932 |
| 2015 | $4,319 | $194,457 | $50,000 | $144,457 |
Source: Public Records
Map
Nearby Homes
- 4009 Sioux Dr
- 816 Osage Dr
- 701 Kiowa Dr
- 1209 Evers Dr
- 7216 Raynor Place
- 1221 Evers Dr
- 513 Wichita Trail
- Dalhart - 4448 SPR Plan at Aster Park
- Meridian - SH 4439 Plan at Aster Park
- Lavon - 4453SPR Plan at Aster Park
- Barton - SH 4441 Plan at Aster Park
- Sweeny - 4455 AP Plan at Aster Park
- Heath - 4452SPR Plan at Aster Park
- Catarina - SH 4456 Plan at Aster Park
- Burnet - 4440 AP Plan at Aster Park
- Anson - 4437 AP Plan at Aster Park
- Carmine - SH 4461 Plan at Aster Park
- Rockport - SH 4442 Plan at Aster Park
- Benbrook - SH 4459 Plan at Aster Park
- 620 Cypress Hill Dr