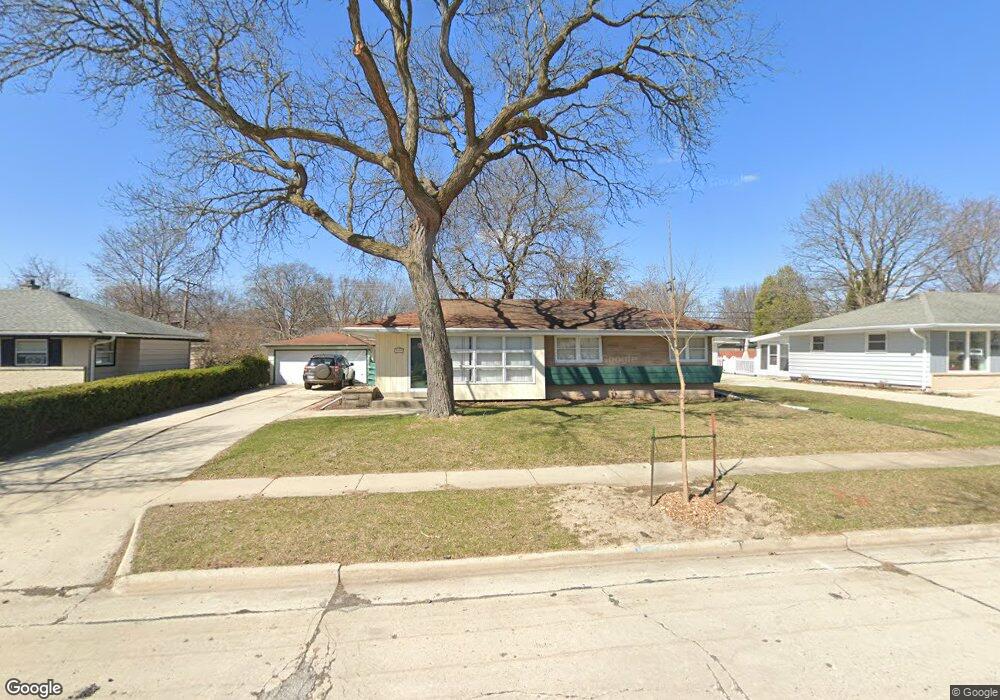
4009 S 73rd St Milwaukee, WI 53220
Wedgewood NeighborhoodEstimated Value: $292,000 - $356,000
3
Beds
2
Baths
1,354
Sq Ft
$238/Sq Ft
Est. Value
About This Home
This home is located at 4009 S 73rd St, Milwaukee, WI 53220 and is currently estimated at $322,185, approximately $237 per square foot. 4009 S 73rd St is a home located in Milwaukee County with nearby schools including Milwaukee Spanish Immersion School - Upper Campus, Milwaukee German Immersion School, and Craig Montessori School.
Ownership History
Date
Name
Owned For
Owner Type
Purchase Details
Closed on
Oct 26, 2012
Sold by
Guman Ricky J
Bought by
Grzanna Mark and Grzanna Anna Lisa
Current Estimated Value
Home Financials for this Owner
Home Financials are based on the most recent Mortgage that was taken out on this home.
Original Mortgage
$128,250
Outstanding Balance
$88,665
Interest Rate
3.4%
Mortgage Type
New Conventional
Estimated Equity
$233,520
Purchase Details
Closed on
May 12, 2003
Sold by
Guman Ricky L
Bought by
Guman Ricky J
Purchase Details
Closed on
Jul 29, 2002
Sold by
Carroll Jill E
Bought by
Guman Ricky L
Home Financials for this Owner
Home Financials are based on the most recent Mortgage that was taken out on this home.
Original Mortgage
$70,000
Interest Rate
6.06%
Mortgage Type
Purchase Money Mortgage
Create a Home Valuation Report for This Property
The Home Valuation Report is an in-depth analysis detailing your home's value as well as a comparison with similar homes in the area
Home Values in the Area
Average Home Value in this Area
Purchase History
| Date | Buyer | Sale Price | Title Company |
|---|---|---|---|
| Grzanna Mark | $135,000 | None Available | |
| Guman Ricky J | -- | Advent Title Llc | |
| Guman Ricky L | $149,000 | Advent Title Llc |
Source: Public Records
Mortgage History
| Date | Status | Borrower | Loan Amount |
|---|---|---|---|
| Open | Grzanna Mark | $128,250 | |
| Previous Owner | Guman Ricky L | $70,000 |
Source: Public Records
Tax History Compared to Growth
Tax History
| Year | Tax Paid | Tax Assessment Tax Assessment Total Assessment is a certain percentage of the fair market value that is determined by local assessors to be the total taxable value of land and additions on the property. | Land | Improvement |
|---|---|---|---|---|
| 2024 | $4,947 | $231,800 | $45,600 | $186,200 |
| 2023 | $4,572 | $193,500 | $45,600 | $147,900 |
| 2022 | $4,292 | $193,500 | $45,600 | $147,900 |
| 2021 | $4,335 | $177,000 | $45,600 | $131,400 |
| 2020 | $4,373 | $177,000 | $45,600 | $131,400 |
| 2019 | $3,898 | $155,300 | $45,900 | $109,400 |
| 2018 | $3,788 | $155,300 | $45,900 | $109,400 |
| 2017 | $3,886 | $149,800 | $48,100 | $101,700 |
| 2016 | $3,936 | $144,700 | $48,100 | $96,600 |
| 2015 | $4,036 | $144,700 | $48,100 | $96,600 |
| 2014 | $3,998 | $140,600 | $48,100 | $92,500 |
| 2013 | -- | $136,300 | $48,100 | $88,200 |
Source: Public Records
Map
Nearby Homes
- 3965 S 75th St
- 3984 S 72nd St
- 3812 S 74th St
- 3700 S Massachusetts Ave
- 8101 W Tripoli Ave Unit 8103
- 3558 S 75th St
- 3573 S 76th St
- 7911 W Cold Spring Rd
- 4442 S Greenridge Cir Unit 4442F
- 3514 S Massachusetts Ave
- 8200 W New Jersey Ave
- 6420 W Dodge Place Unit 22
- 3965 S 84th St Unit 5
- 7001 W Allerton Ave
- 4431 S 67th St
- 6818 W Morgan Ave
- 3939 S 85th St
- 3717 S 84th St
- 6151 W Howard Ave Unit C32
- 8112 W Morgan Ave