401 Elm St Earlville, IL 60518
Estimated Value: $171,000 - $260,000
4
Beds
2
Baths
1,600
Sq Ft
$133/Sq Ft
Est. Value
About This Home
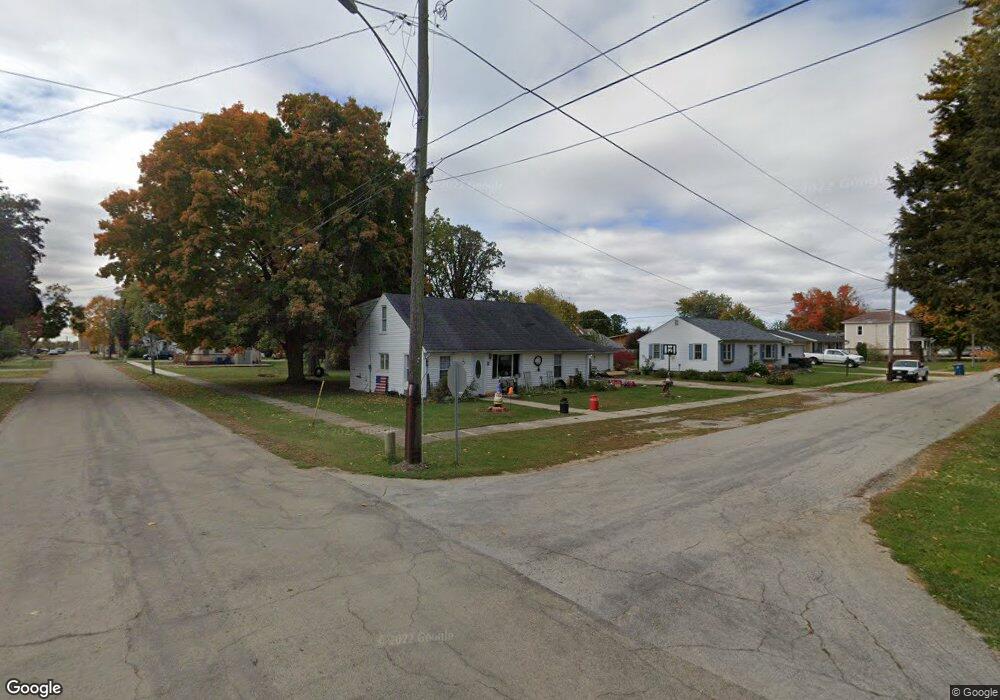
This home is located at 401 Elm St, Earlville, IL 60518 and is currently estimated at $213,283, approximately $133 per square foot. 401 Elm St is a home located in LaSalle County with nearby schools including Earlville Elementary School and Earlville Junior/Senior High School.
Ownership History
Date
Name
Owned For
Owner Type
Purchase Details
Closed on
Jan 11, 2021
Sold by
Equity One Investment Fund Llc
Bought by
Bridge Joshua
Current Estimated Value
Purchase Details
Closed on
Nov 13, 2013
Sold by
Lasalle County Clerk
Bought by
Equity One Investment Fund Llc
Purchase Details
Closed on
Apr 21, 2010
Sold by
Federal Home Loan Mortgage Corporation
Bought by
Watson Paul
Purchase Details
Closed on
Mar 16, 2010
Sold by
Reiter John W and Reiter Wendy R
Bought by
The National Bank & Trust Companay Of Sy
Create a Home Valuation Report for This Property
The Home Valuation Report is an in-depth analysis detailing your home's value as well as a comparison with similar homes in the area
Home Values in the Area
Average Home Value in this Area
Purchase History
| Date | Buyer | Sale Price | Title Company |
|---|---|---|---|
| Bridge Joshua | -- | None Available | |
| Equity One Investment Fund Llc | -- | None Available | |
| Watson Paul | $32,500 | First American Title | |
| The National Bank & Trust Companay Of Sy | -- | None Available |
Source: Public Records
Tax History Compared to Growth
Tax History
| Year | Tax Paid | Tax Assessment Tax Assessment Total Assessment is a certain percentage of the fair market value that is determined by local assessors to be the total taxable value of land and additions on the property. | Land | Improvement |
|---|---|---|---|---|
| 2024 | $3,738 | $50,591 | $3,545 | $47,046 |
| 2023 | $3,363 | $44,687 | $3,131 | $41,556 |
| 2022 | $3,095 | $40,067 | $6,340 | $33,727 |
| 2021 | $3,150 | $39,382 | $6,232 | $33,150 |
| 2020 | $3,040 | $38,201 | $6,045 | $32,156 |
| 2019 | $2,956 | $36,549 | $5,784 | $30,765 |
| 2018 | $2,610 | $32,437 | $5,562 | $26,875 |
| 2017 | $2,999 | $29,604 | $5,076 | $24,528 |
| 2016 | $2,873 | $27,667 | $4,744 | $22,923 |
| 2015 | $1,389 | $26,508 | $4,545 | $21,963 |
| 2012 | -- | $31,144 | $5,340 | $25,804 |
Source: Public Records
Map
Nearby Homes