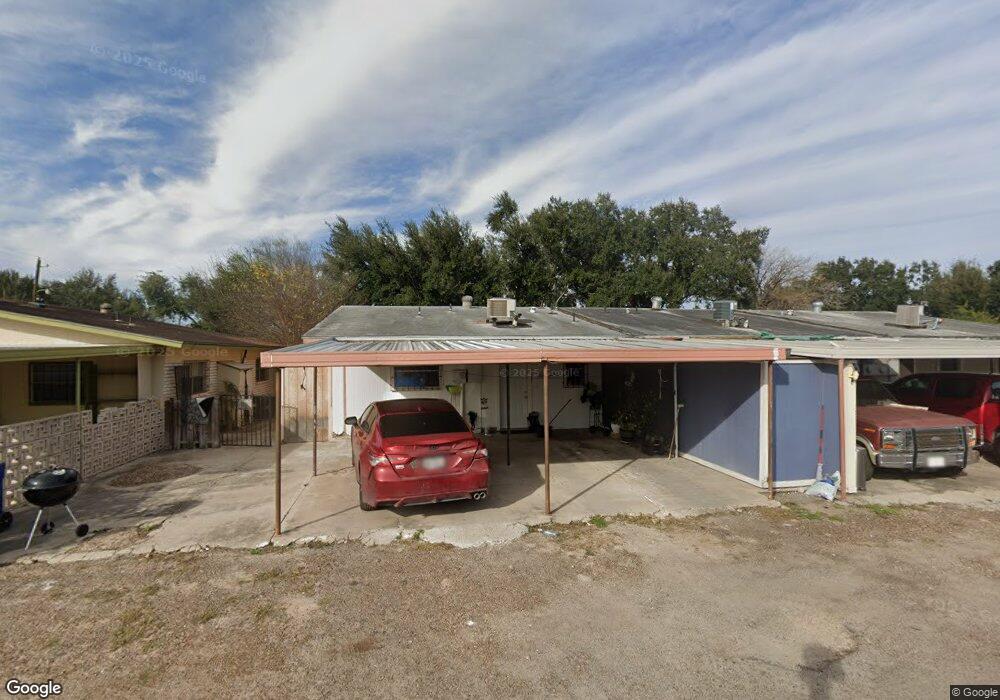
401 N 41st St McAllen, TX 78501
Estimated Value: $116,093 - $154,000
3
Beds
2
Baths
1,260
Sq Ft
$110/Sq Ft
Est. Value
About This Home
This home is located at 401 N 41st St, McAllen, TX 78501 and is currently estimated at $139,023, approximately $110 per square foot. 401 N 41st St is a home located in Hidalgo County with nearby schools including Alvarez Elementary School, De Leon Middle School, and Rowe High School.
Ownership History
Date
Name
Owned For
Owner Type
Purchase Details
Closed on
Mar 30, 2016
Sold by
Flores Rafael H
Bought by
Garza Isaac
Current Estimated Value
Home Financials for this Owner
Home Financials are based on the most recent Mortgage that was taken out on this home.
Original Mortgage
$58,761
Outstanding Balance
$46,728
Interest Rate
3.71%
Estimated Equity
$92,295
Purchase Details
Closed on
May 2, 2012
Sold by
First National Bank
Bought by
Garza Elizabeth
Home Financials for this Owner
Home Financials are based on the most recent Mortgage that was taken out on this home.
Original Mortgage
$53,000
Interest Rate
3.9%
Mortgage Type
Seller Take Back
Purchase Details
Closed on
Oct 27, 2010
Sold by
Cortez Amado and Cortez Virginia
Bought by
Gonzalez Juana S and Gonzalez Roberto
Home Financials for this Owner
Home Financials are based on the most recent Mortgage that was taken out on this home.
Original Mortgage
$49,000
Interest Rate
4.41%
Mortgage Type
New Conventional
Create a Home Valuation Report for This Property
The Home Valuation Report is an in-depth analysis detailing your home's value as well as a comparison with similar homes in the area
Home Values in the Area
Average Home Value in this Area
Purchase History
| Date | Buyer | Sale Price | Title Company |
|---|---|---|---|
| Garza Isaac | -- | -- | |
| Garza Elizabeth | -- | Vltc | |
| Gonzalez Juana S | -- | Landtitleusa Inc |
Source: Public Records
Mortgage History
| Date | Status | Borrower | Loan Amount |
|---|---|---|---|
| Open | Garza Isaac | $58,761 | |
| Closed | Garza Isaac | -- | |
| Previous Owner | Garza Elizabeth | $53,000 | |
| Previous Owner | Gonzalez Juana S | $49,000 |
Source: Public Records
Tax History Compared to Growth
Tax History
| Year | Tax Paid | Tax Assessment Tax Assessment Total Assessment is a certain percentage of the fair market value that is determined by local assessors to be the total taxable value of land and additions on the property. | Land | Improvement |
|---|---|---|---|---|
| 2025 | $1,540 | $110,864 | $23,688 | $87,176 |
| 2024 | $1,540 | $65,667 | $17,766 | $47,901 |
| 2023 | $1,480 | $62,917 | $17,766 | $45,151 |
| 2022 | $1,560 | $62,917 | $17,766 | $45,151 |
| 2021 | $1,354 | $53,000 | $17,766 | $35,234 |
| 2020 | $1,343 | $52,638 | $17,766 | $34,872 |
| 2019 | $1,335 | $52,638 | $17,766 | $34,872 |
| 2018 | $1,150 | $45,269 | $11,252 | $34,017 |
| 2017 | $1,155 | $45,269 | $11,252 | $34,017 |
| 2016 | $1,155 | $45,269 | $11,252 | $34,017 |
| 2015 | $1,068 | $41,716 | $7,699 | $34,017 |
Source: Public Records
Map
Nearby Homes
- 411 N 41st St Unit 2
- 401 N 41st St Unit 16
- 517 N 41st Ct
- 313 N 40th St
- 4000 Eucaliptus Ave
- 405 N 39th St
- 3905 Fir Ave
- 4316 Date Palm Ave
- 4212 Gumwood Cir
- 325 N 36th Ln
- 512 N Ware Rd
- 1003 N 40th Ln
- 500 N 36th St
- 506 N 36th St
- 912 N Bentsen Rd
- 3801 W Us Highway Business 83 Hwy W
- 736 N 46th St
- 600 N 35th St
- 4701 Ebony Ave
- 4701 Date Palm Ave
- 401 N 41st St
- 401 N 41st St
- 401 N 41st St
- 401 N 41st St
- 401 N 41st St
- 401 N 41st St
- 401 N 41st St
- 401 N 41st St Unit 10
- 401 N 41st St Unit 12
- 401 N 41st St Unit 13
- 405 N 41st St
- 407 N 41st St
- 317 N 41st St
- 321 N 41st St
- 411 N 41st St
- 411 N 41st St
- 411 N 41st St
- 411 N 41st St
- 411 N 41st St
- 411 N 41st St