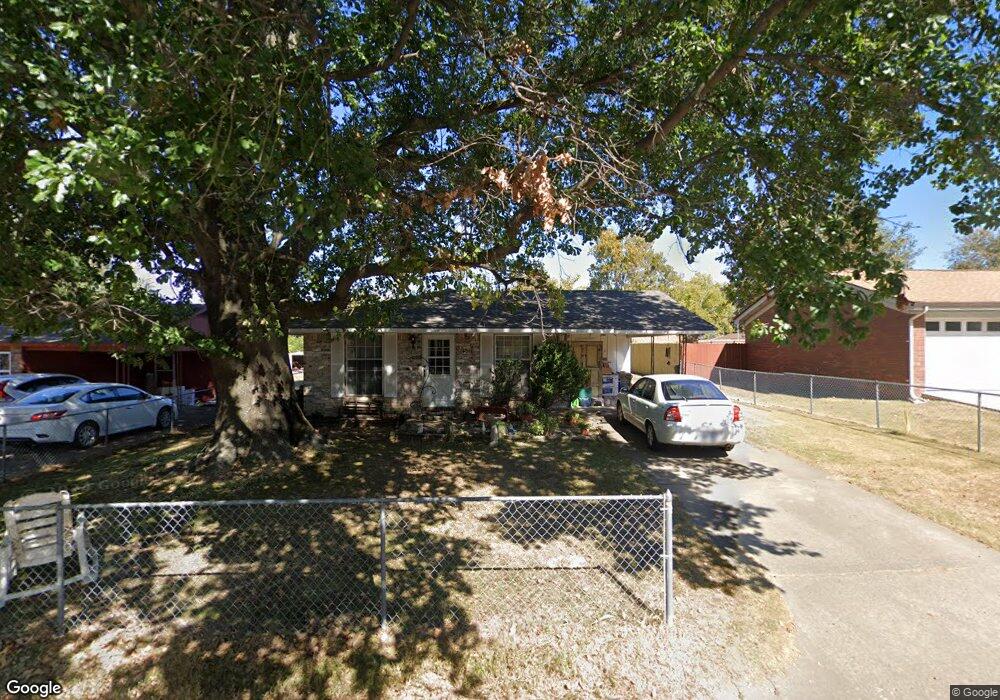
4011 Pond St van Buren, AR 72956
Estimated Value: $115,550 - $156,000
--
Bed
2
Baths
936
Sq Ft
$143/Sq Ft
Est. Value
About This Home
This home is located at 4011 Pond St, van Buren, AR 72956 and is currently estimated at $133,388, approximately $142 per square foot. 4011 Pond St is a home located in Crawford County with nearby schools including James R. Tate Elementary School, Butterfield Trail Middle School, and Van Buren High School.
Ownership History
Date
Name
Owned For
Owner Type
Purchase Details
Closed on
Dec 21, 2006
Sold by
Franklin Matthew Brian and Franklin Lillie Mae
Bought by
Wagner Lorna Louise
Current Estimated Value
Home Financials for this Owner
Home Financials are based on the most recent Mortgage that was taken out on this home.
Original Mortgage
$58,088
Outstanding Balance
$34,730
Interest Rate
6.31%
Mortgage Type
FHA
Estimated Equity
$98,658
Purchase Details
Closed on
Sep 8, 2003
Bought by
Tupper and Raney
Purchase Details
Closed on
Feb 7, 2002
Bought by
Raney Susan E and Tupper Fred A
Purchase Details
Closed on
Jun 16, 1999
Bought by
White-Raney and Tupper
Create a Home Valuation Report for This Property
The Home Valuation Report is an in-depth analysis detailing your home's value as well as a comparison with similar homes in the area
Home Values in the Area
Average Home Value in this Area
Purchase History
| Date | Buyer | Sale Price | Title Company |
|---|---|---|---|
| Wagner Lorna Louise | -- | -- | |
| Tupper | $45,000 | -- | |
| Raney Susan E | $35,000 | -- | |
| White-Raney | $43,000 | -- |
Source: Public Records
Mortgage History
| Date | Status | Borrower | Loan Amount |
|---|---|---|---|
| Open | Wagner Lorna Louise | $58,088 |
Source: Public Records
Tax History Compared to Growth
Tax History
| Year | Tax Paid | Tax Assessment Tax Assessment Total Assessment is a certain percentage of the fair market value that is determined by local assessors to be the total taxable value of land and additions on the property. | Land | Improvement |
|---|---|---|---|---|
| 2025 | $75 | $19,190 | $3,000 | $16,190 |
| 2024 | $75 | $19,190 | $3,000 | $16,190 |
| 2023 | $150 | $19,190 | $3,000 | $16,190 |
| 2022 | $200 | $11,100 | $2,000 | $9,100 |
| 2021 | $200 | $11,100 | $2,000 | $9,100 |
| 2020 | $200 | $11,100 | $2,000 | $9,100 |
| 2019 | $200 | $11,100 | $2,000 | $9,100 |
| 2018 | $225 | $11,100 | $2,000 | $9,100 |
| 2017 | $225 | $11,080 | $2,000 | $9,080 |
| 2016 | $225 | $11,080 | $2,000 | $9,080 |
| 2015 | $192 | $11,080 | $2,000 | $9,080 |
| 2014 | $192 | $11,080 | $2,000 | $9,080 |
Source: Public Records
Map
Nearby Homes