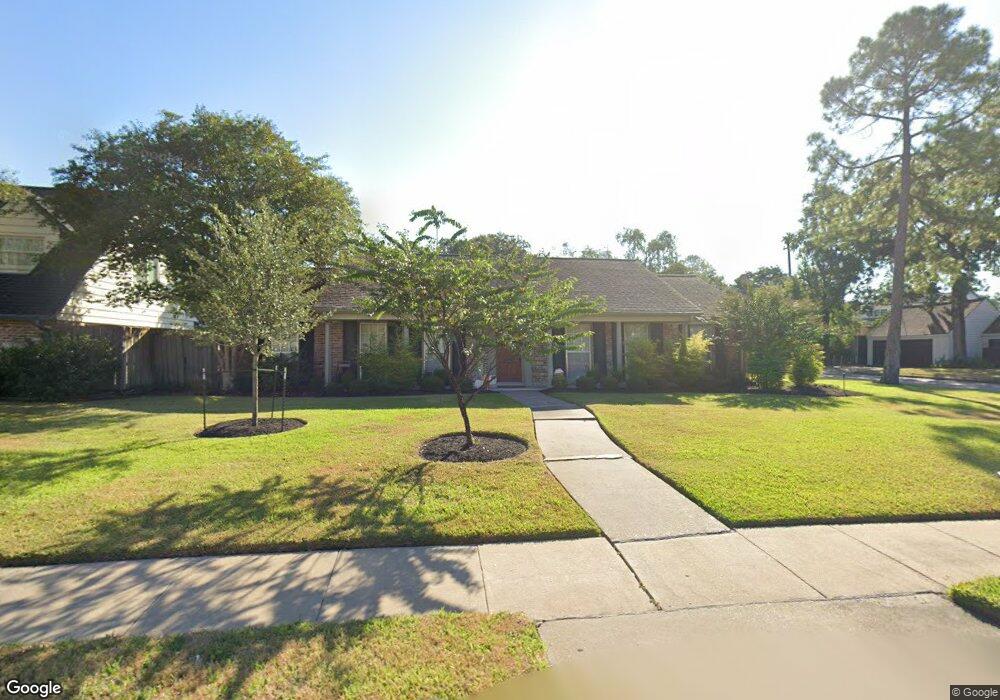
402 N Wilcrest Dr Houston, TX 77079
Memorial NeighborhoodEstimated Value: $757,288 - $875,000
4
Beds
3
Baths
2,074
Sq Ft
$394/Sq Ft
Est. Value
About This Home
This home is located at 402 N Wilcrest Dr, Houston, TX 77079 and is currently estimated at $817,822, approximately $394 per square foot. 402 N Wilcrest Dr is a home located in Harris County with nearby schools including Rummel Creek Elementary School, Memorial Middle, and Stratford High School.
Ownership History
Date
Name
Owned For
Owner Type
Purchase Details
Closed on
Sep 1, 2016
Sold by
Mcjunkin Keith David and Mcjunkin Mary Helen
Bought by
Mcjunkin Keith and Mcjunkin Mary
Current Estimated Value
Purchase Details
Closed on
Jul 10, 1998
Sold by
Cable D Gregory and Cable Jayne
Bought by
Mcjunkin Keith David and Mcjunkin Mary Helen
Home Financials for this Owner
Home Financials are based on the most recent Mortgage that was taken out on this home.
Original Mortgage
$140,000
Interest Rate
6.95%
Purchase Details
Closed on
Aug 2, 1995
Sold by
Tulloch Gary E and Tulloch Lizbeth A
Bought by
Cable D Gregory
Home Financials for this Owner
Home Financials are based on the most recent Mortgage that was taken out on this home.
Original Mortgage
$109,800
Interest Rate
7.54%
Create a Home Valuation Report for This Property
The Home Valuation Report is an in-depth analysis detailing your home's value as well as a comparison with similar homes in the area
Home Values in the Area
Average Home Value in this Area
Purchase History
| Date | Buyer | Sale Price | Title Company |
|---|---|---|---|
| Mcjunkin Keith | -- | None Available | |
| Mcjunkin Keith David | -- | First American Title | |
| Cable D Gregory | -- | First American Title |
Source: Public Records
Mortgage History
| Date | Status | Borrower | Loan Amount |
|---|---|---|---|
| Previous Owner | Mcjunkin Keith David | $140,000 | |
| Previous Owner | Cable D Gregory | $109,800 | |
| Closed | Mcjunkin Keith David | $17,500 |
Source: Public Records
Tax History Compared to Growth
Tax History
| Year | Tax Paid | Tax Assessment Tax Assessment Total Assessment is a certain percentage of the fair market value that is determined by local assessors to be the total taxable value of land and additions on the property. | Land | Improvement |
|---|---|---|---|---|
| 2025 | $4,541 | $686,994 | $438,495 | $248,499 |
| 2024 | $4,541 | $685,000 | $438,495 | $246,505 |
| 2023 | $4,541 | $717,255 | $438,495 | $278,760 |
| 2022 | $12,758 | $682,930 | $367,770 | $315,160 |
| 2021 | $12,112 | $548,690 | $353,625 | $195,065 |
| 2020 | $11,300 | $546,850 | $353,625 | $193,225 |
| 2019 | $10,734 | $410,000 | $353,625 | $56,375 |
| 2018 | $4,483 | $458,000 | $353,625 | $104,375 |
| 2017 | $11,982 | $458,000 | $353,625 | $104,375 |
| 2016 | $12,924 | $494,000 | $353,625 | $140,375 |
| 2015 | $8,734 | $494,000 | $353,625 | $140,375 |
| 2014 | $8,734 | $420,000 | $282,900 | $137,100 |
Source: Public Records
Map
Nearby Homes
- 334 Wycliffe Dr
- 13403 Taylorcrest Rd
- 414 E Gaywood Dr
- 13131 Kimberley Ln
- 807 Wycliffe Dr
- 127 Gershwin Dr
- 327 Electra Dr
- 12910 Traviata Dr
- 210 Big Hollow Ln
- 12903 Tosca Ln
- 710 Patchester Dr
- 839 Wax Myrtle Ln
- 903 Wycliffe Dr
- 203 Cove Creek Ln
- 13004 Trail Hollow Dr Unit A
- 893 Wax Myrtle Ln Unit 3
- 903 Wax Myrtle Ln
- 921 Wax Myrtle Ln
- 807 Patchester Dr
- 939 Wax Myrtle Ln
- 406 N Wilcrest Dr
- 403 Wycliffe Dr
- 407 Wycliffe Dr
- 410 N Wilcrest Dr
- 363 Wycliffe Dr
- 13302 Apple Tree Rd
- 411 Wycliffe Dr
- 414 N Wilcrest Dr
- 13303 Apple Tree Rd
- 359 Wycliffe Dr
- 13303 Alchester Ln
- 415 Wycliffe Dr
- 13306 Apple Tree Rd
- 326 N Wilcrest Dr
- 13307 Apple Tree Rd
- 402 Wycliffe Dr
- 418 N Wilcrest Dr
- 13302 Conifer Rd
- 13307 Alchester Ln
- 419 Wycliffe Dr