Estimated Value: $139,193 - $171,000
--
Bed
2
Baths
1,576
Sq Ft
$101/Sq Ft
Est. Value
About This Home
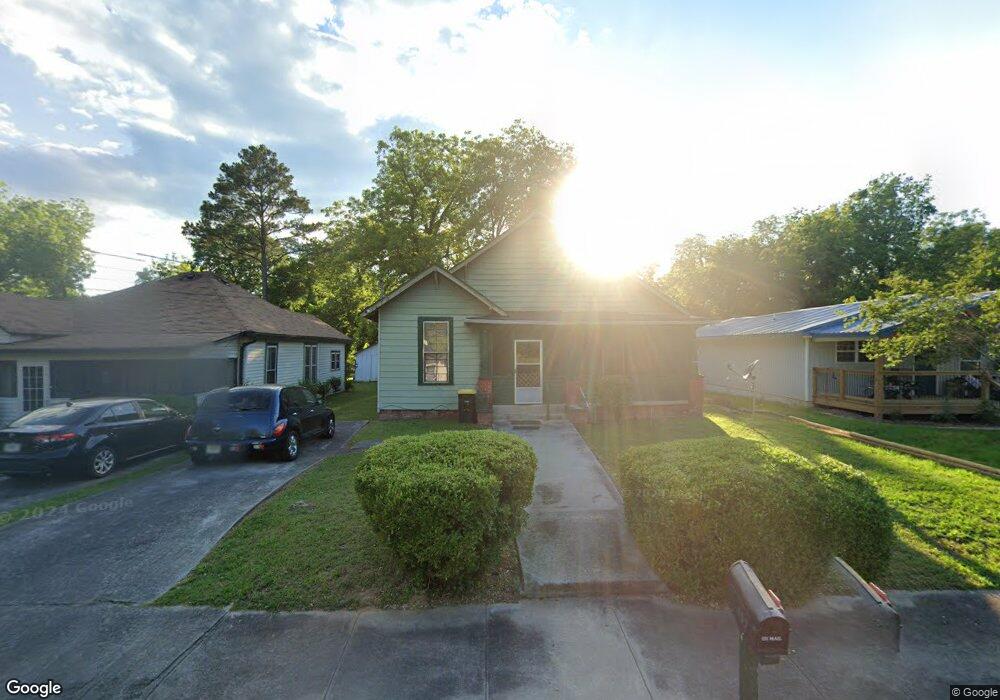
This home is located at 402 Pennington Ave SW, Rome, GA 30161 and is currently estimated at $159,798, approximately $101 per square foot. 402 Pennington Ave SW is a home located in Floyd County with nearby schools including Dan McCarty Middle School, Rome High School, and Darlington School.
Ownership History
Date
Name
Owned For
Owner Type
Purchase Details
Closed on
Dec 31, 1996
Sold by
Smith Sharon N
Bought by
Pasley Sharon N Fka Sharon N Smith
Current Estimated Value
Purchase Details
Closed on
Aug 11, 1995
Bought by
P and R
Purchase Details
Closed on
Mar 30, 1994
Sold by
City Of Rome The
Bought by
Smith Sharon N
Purchase Details
Closed on
Nov 2, 1993
Sold by
Turner James
Bought by
City Of Rome The
Purchase Details
Closed on
Feb 27, 1981
Bought by
P and R
Purchase Details
Closed on
Aug 6, 1973
Sold by
Harbour Raymond
Bought by
Turner James
Purchase Details
Closed on
Aug 3, 1973
Sold by
Mann Thomas J Et Al Thomas J Mann and Mann Miss
Bought by
Harbour Raymond
Purchase Details
Closed on
Jul 31, 1972
Sold by
Mann T A Est
Bought by
Mann Thomas J Et Al Thomas J Mann
Purchase Details
Closed on
Aug 27, 1920
Bought by
Mann T A Est
Create a Home Valuation Report for This Property
The Home Valuation Report is an in-depth analysis detailing your home's value as well as a comparison with similar homes in the area
Home Values in the Area
Average Home Value in this Area
Purchase History
| Date | Buyer | Sale Price | Title Company |
|---|---|---|---|
| Pasley Sharon N Fka Sharon N Smith | -- | -- | |
| P | -- | -- | |
| Smith Sharon N | -- | -- | |
| City Of Rome The | -- | -- | |
| P | -- | -- | |
| Turner James | $7,500 | -- | |
| Harbour Raymond | $5,000 | -- | |
| Mann Thomas J Et Al Thomas J Mann | -- | -- | |
| Mann T A Est | -- | -- |
Source: Public Records
Tax History Compared to Growth
Tax History
| Year | Tax Paid | Tax Assessment Tax Assessment Total Assessment is a certain percentage of the fair market value that is determined by local assessors to be the total taxable value of land and additions on the property. | Land | Improvement |
|---|---|---|---|---|
| 2024 | $1,896 | $48,859 | $4,759 | $44,100 |
| 2023 | $458 | $46,576 | $4,326 | $42,250 |
| 2022 | $364 | $31,600 | $3,461 | $28,139 |
| 2021 | $372 | $28,610 | $3,461 | $25,149 |
| 2020 | $377 | $26,358 | $2,704 | $23,654 |
| 2019 | $371 | $24,864 | $2,704 | $22,160 |
| 2018 | $371 | $23,369 | $2,704 | $20,665 |
| 2017 | $371 | $22,460 | $2,704 | $19,756 |
| 2016 | $373 | $21,371 | $2,680 | $18,691 |
| 2015 | $749 | $21,371 | $2,680 | $18,691 |
| 2014 | $749 | $21,371 | $2,680 | $18,691 |
Source: Public Records
Map
Nearby Homes
- 107 Butler St SW
- 3 Grover St SW
- 110 Cherokee St SW
- 18 Butler St SW
- 334 Branham Ave SW
- 515 Harper Ave SW
- 410 Hardy Ave SW
- 232 S Broad St SW
- 105 Mary St SW
- 515 S Broad St SW
- 115 Lookout Cir SW
- 113 Lookout Cir SW
- 111 Lookout Cir SW
- 529 Branham Ave SW
- 3 Porter St SW
- 101 Hardy Ave SW
- 204 Myrtle St SW
- 218 Wilson Ave SW
- 400 Pennington Ave SW
- 404 Pennington Ave SW
- 406 Pennington Ave SW
- 0 Pennington Ave SW Unit 7521570
- 0 Pennington Ave SW Unit 7312030
- 0 Pennington Ave SW Unit 9022944
- 0 Pennington Ave SW Unit 7331418
- 0 Pennington Ave SW Unit 7427106
- 0 Pennington Ave SW Unit 8469637
- 312 Pennington Ave SW
- 419 Branham Ave SW
- 415 Branham Ave SW
- 410 Pennington Ave SW
- 310 Pennington Ave SW
- 421 Branham Ave SW
- 413 Branham Ave SW
- 409 Pennington Ave SW
- 407 Pennington Ave SW
- 403 Pennington Ave SW
- 411 Pennington Ave SW